It’s getting a lot harder for the average American family to afford a house these days.
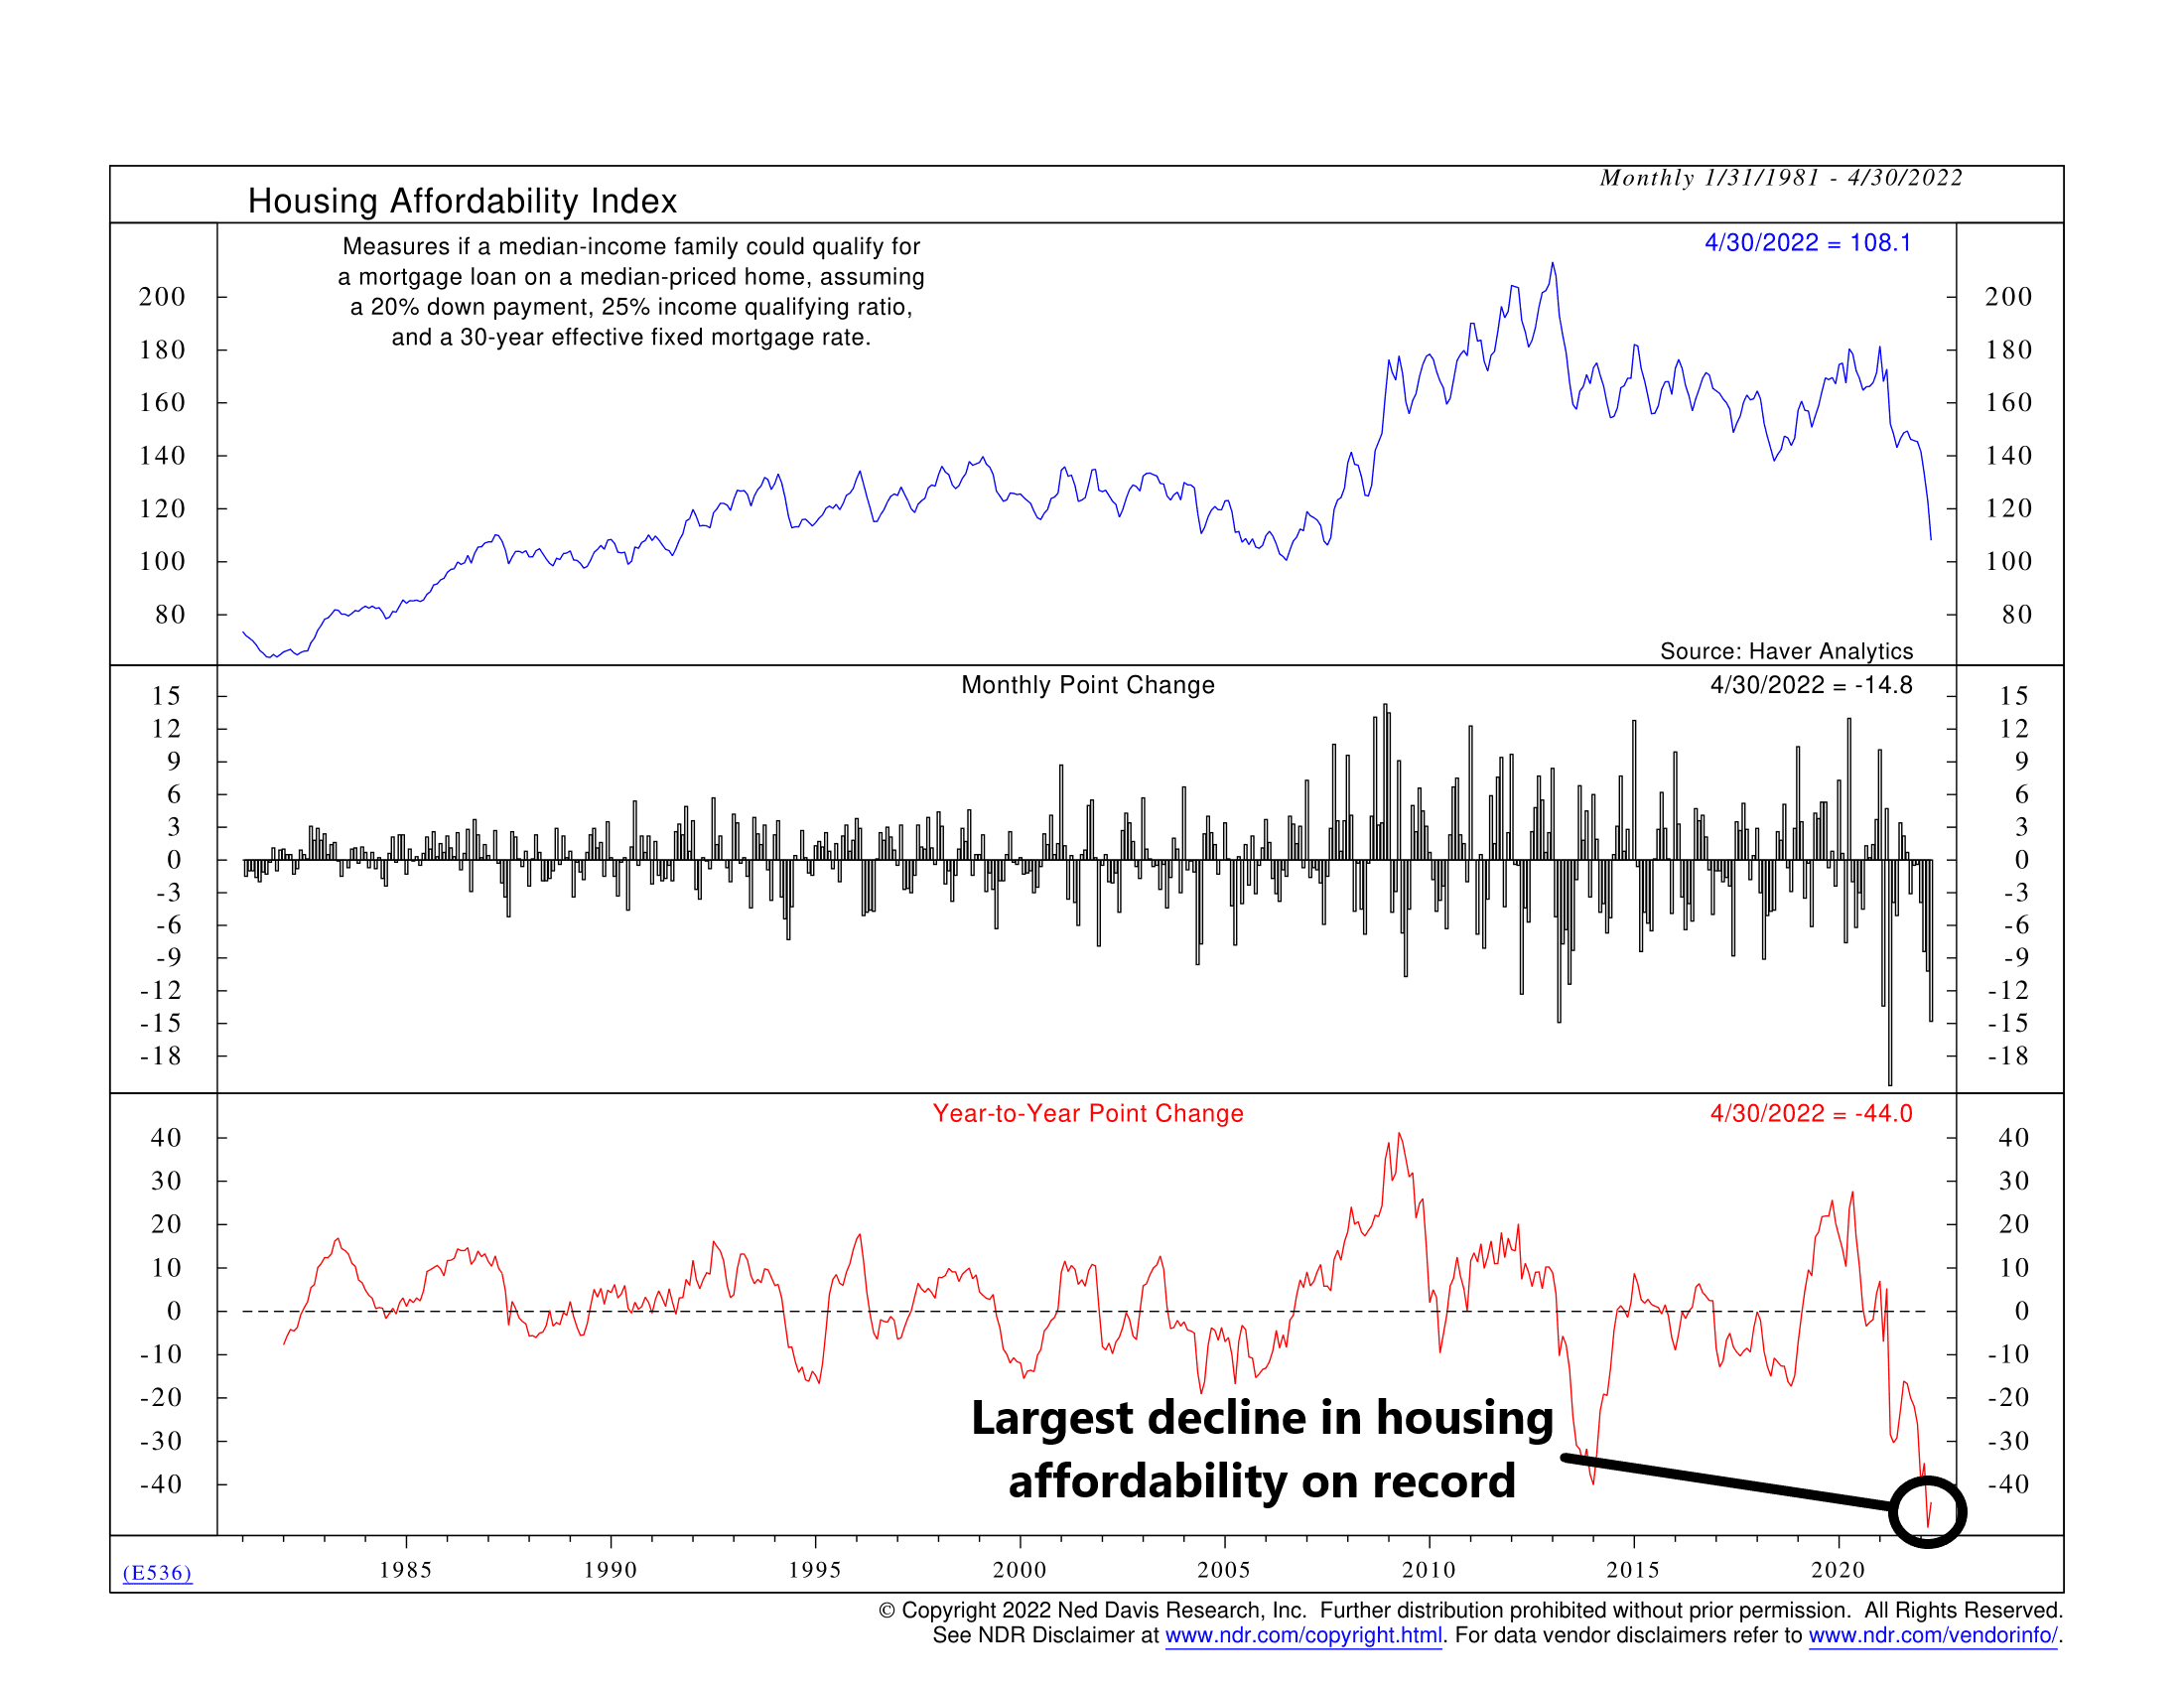
As shown on our featured chart above, the Housing Affordability Index (blue line, top clip) has fallen off a cliff. Compared to last year, the index has dropped 44 points (red line, bottom clip), the largest drop on record.
This Housing Affordability Index measures whether an average-income family could qualify for a mortgage loan on an average-priced home based on standard qualifying metrics. It’s affected by things like mortgage rates and home prices, both of which have surged in recent months.
For example, the Case-Shiller index, a popular gauge of home prices, rose 20.6% earlier this year. That’s the largest year-over-year gain on record. And rates for a conventional 30-year fixed-rate mortgage have jumped from 3% to well over 5% in the span of just a year.
So, it’s been the proverbial “perfect storm” for the housing market this year. Given this dramatic decline in affordability, however, we’re likely reaching the peak in home price appreciation levels. The question, then, is how much and how fast will home prices decline from here?
This is intended for informational purposes only and should not be used as the primary basis for an investment decision. Consult an advisor for your personal situation.
Indices mentioned are unmanaged, do not incur fees, and cannot be invested into directly.
Past performance does not guarantee future results.