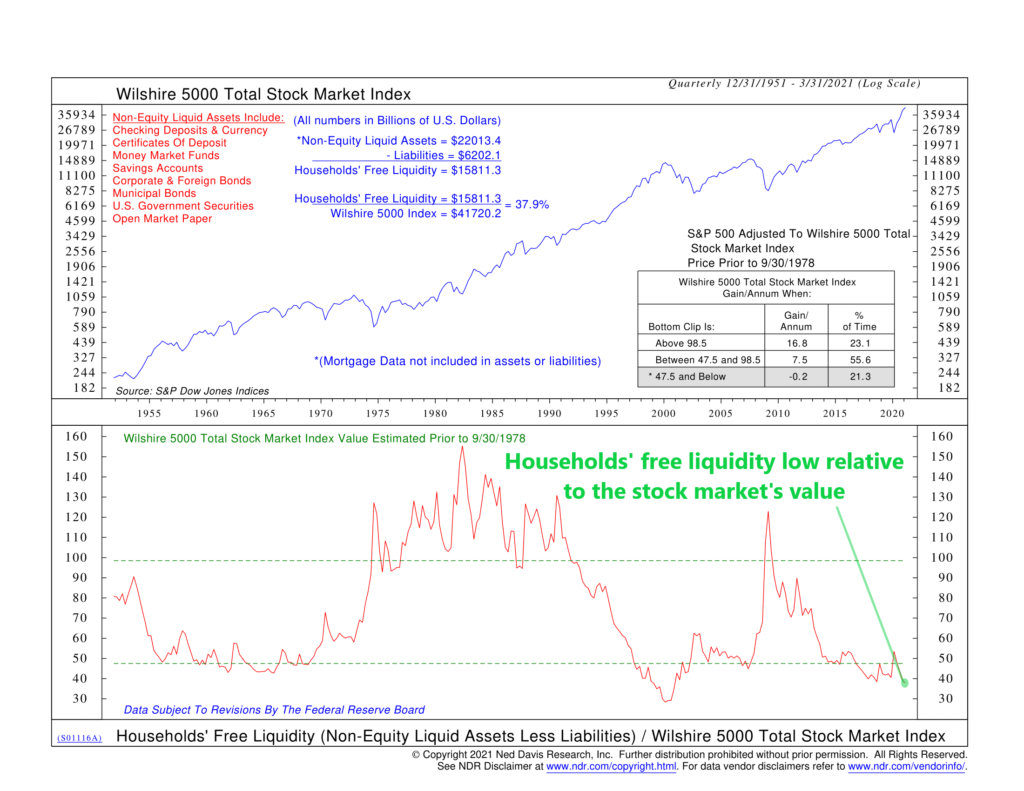
The stock market loves liquidity; it thrives when excess cash or other liquid assets are available to buy stocks. To illustrate this concept, the chart above shows a measure of household liquidity—called household free liquidity—versus the value of the stock market.
The liquid assets included in this measure are listed in red at the top of the chart. It has all the things we typically think of as liquid assets—like checking deposits, cash, savings accounts, CDs, and money market funds. But it also includes bonds and others credit market instruments. To get the final households’ free liquidity number, we add up all these non-equity liquid assets and subtract out liabilities (excluding mortgage debt covered by housing assets).
The blue text at the top of the chart spells out this calculation, and it reveals a households’ free liquidity number of about $15,811 billion or $15.8 trillion. Divide that by the value of the Wilshire 5000 Index (a measure of the total U.S. stock market), and we get about 38%.
To put that 38% in context, the bottom half of the chart shows how this measure of household free liquidity has varied as a percentage of the stock market over time. As you can see, it was pretty high in the ‘80s and early ‘90s, reaching levels well above 130%. It then fell precipitously during the great bull market run of the ‘90s, which ended in the dot com crash in 2000, right as the measure hit an all-time low of about 30%.
That’s where we seem to be headed now, after falling consistently from the high of over 120% reached at the beginning of this bull market in 2009. Interestingly, despite all the stimulus flowing from the government to households this past year, overall free liquidity is near historically low levels. On average, stocks have done poorly in this lower zone of free liquidity, so this is something we want to keep an eye on.
This is intended for informational purposes only and should not be used as the primary basis for an investment decision. Consult an advisor for your personal situation.
Indices mentioned are unmanaged, do not incur fees, and cannot be invested into directly.
Past performance does not guarantee future results.