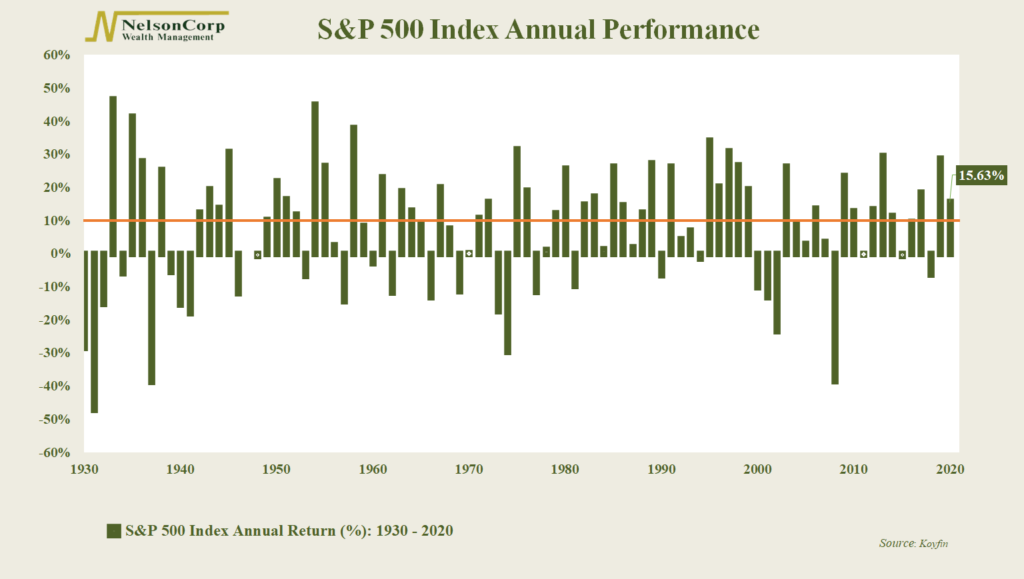
This week’s featured chart looks at the annual performance of the S&P 500 index going back 90+ years. Each green bar represents the annual return of stocks by year, and the orange line marks a gain of 10% or more.
Oddly enough, despite this tumultuous year, the U.S. stock market is poised to end 2020 with a double-digit gain (greater than 10%) for the second year in a row.
Since 1930, this has happened about 25%—or a quarter—of the time.
It is even rarer for the S&P 500 to have a double-digit gain for more than two years in a row, occurring just eight times since 1930. Maybe 2021 will be the ninth?
This is intended for informational purposes only and should not be used as the primary basis for an investment decision. Consult an advisor for your personal situation.
Indices mentioned are unmanaged, do not incur fees, and cannot be invested into directly.
Past performance does not guarantee future results.
