The U.S. federal government is pumping money into the economy at an extraordinary rate lately.
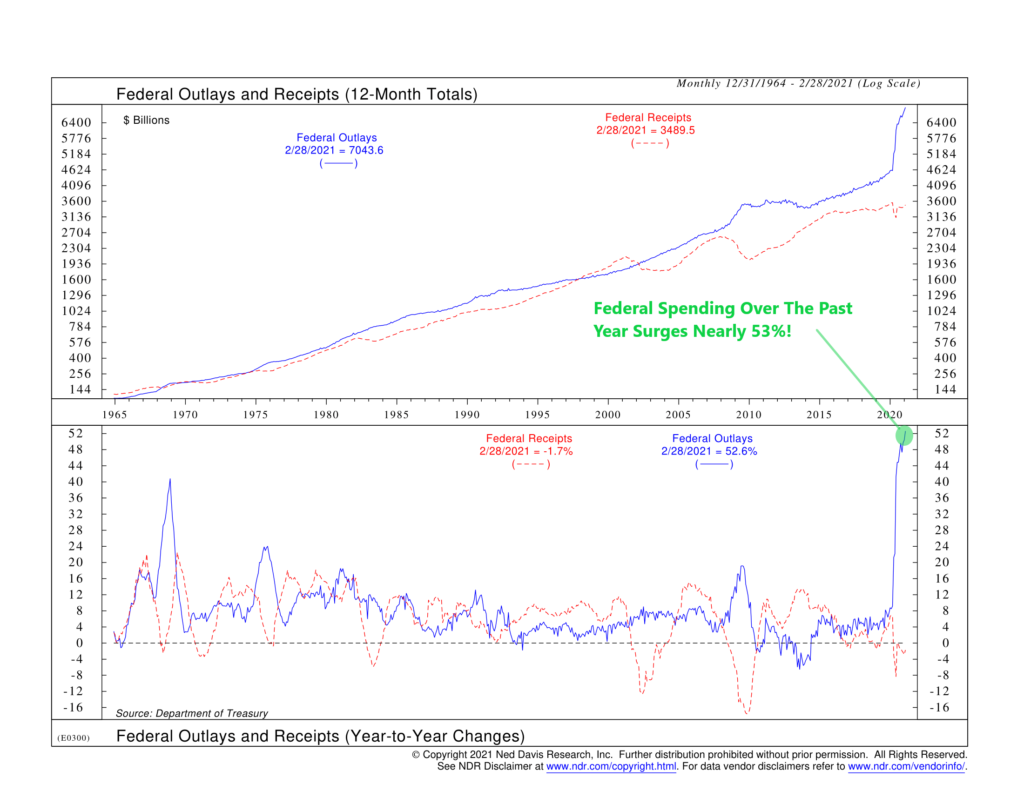
As the top half of our featured chart shows, federal outlays (how much the government spent) reached over $7 trillion on a 12-month total basis last month. By contrast, federal receipts (how much the government collected in taxes) only totaled about $3.5 trillion, resulting in a deficit of about $3.5 trillion, or a record 17% of GDP.
The bottom half of the chart shows those same federal outlays and receipts but as a percentage change from a year ago. The blue line, representing federal outlays, is quite astonishing; it rose nearly 53% from the same time a year ago. This surge was primarily driven by record rates of spending on income security and health-related expenditures.
At the same time, tax receipts (the red dotted line) shrank about 1.7% from a year ago. Millions of Americans are still out of work, and the economy has yet to recover all the growth it lost from the pandemic, so this is not surprising.
And more spending is on the way. With the passage of the $1.9 trillion American Rescue Plan last week, the deficit is projected to reach more than 20% of GDP by the end of the year.
Fortunately, the combination of aggressive stimulus and a fading pandemic has the economy projected to surpass its pre-pandemic level by the end of the year.
This is intended for informational purposes only and should not be used as the primary basis for an investment decision. Consult an advisor for your personal situation.
Indices mentioned are unmanaged, do not incur fees, and cannot be invested into directly.
Past performance does not guarantee future results.