The U.S. federal debt exploded this year after a massive fiscal response to the coronavirus pandemic. By the end of June, total debt had ballooned to $20.5 trillion from $17.7 trillion at the end of March.
This is a huge number. But it only represents one side of the equation. It is more useful to look at total federal debt as a percentage of the economy’s size or gross domestic product (GDP).
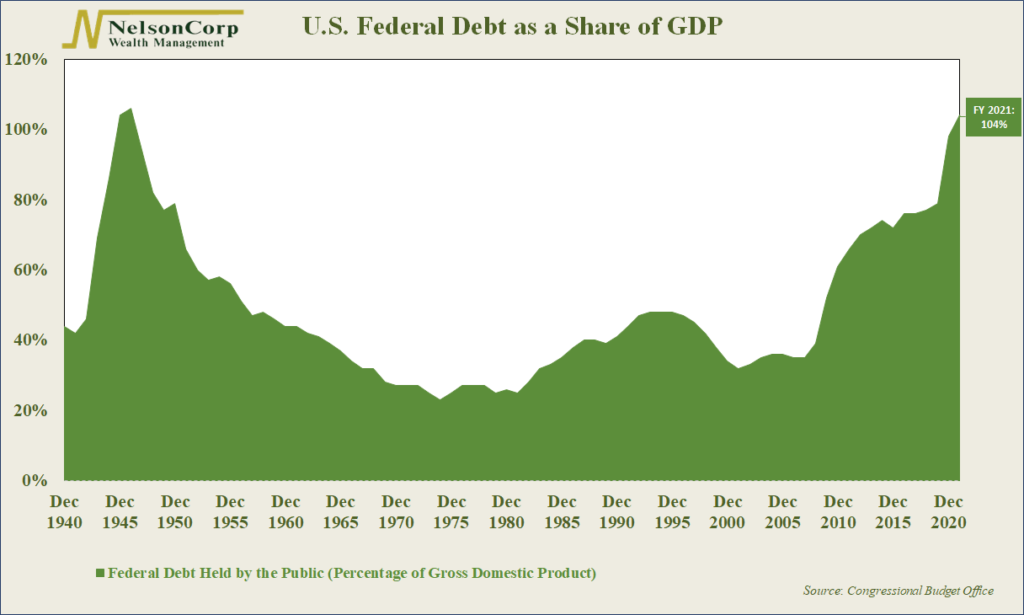
This measure of the U.S. federal debt as a share of GDP is our chart of the week. On Wednesday, the Congressional Budget Office announced that federal debt held by the public is now projected to reach or exceed 100% of the U.S. economy.
The last time the U.S. had this much federal debt as a share of GDP was way back in 1946. After years of military spending to finance World War II, the debt-to-GDP ratio hit 106%, a number we just might surpass in the coming years.
This is intended for informational purposes only and should not be used as the primary basis for an investment decision. Consult an advisor for your personal situation.
Indices mentioned are unmanaged, do not incur fees, and cannot be invested into directly.
Past performance does not guarantee future results.