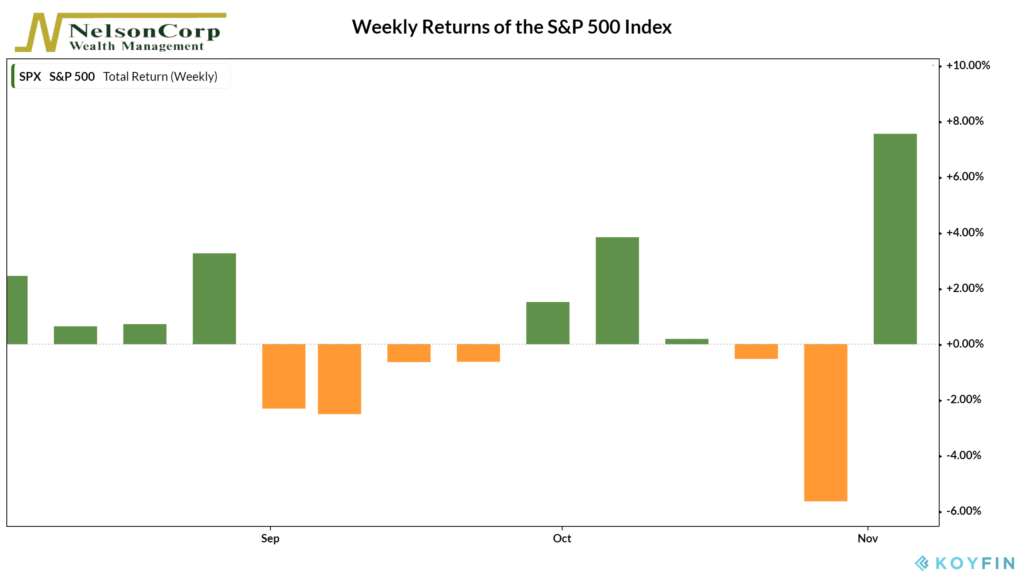
For this week’s chart, we show the weekly returns of the S&P 500 Index over the past three months. Each bar on the graph represents the total return of the stock index for that week.
As expected, returns were quite volatile heading into the election. The market, pricing in the likelihood of a contested election, fell 5.64% the week before the election. That was the worst pre-election week on record.
However, returns snapped right back on election week. As the outcome becomes clearer, the cloud of uncertainty that has plagued the market the past few months is lifting, setting up a typical post-election rally.
This is intended for informational purposes only and should not be used as the primary basis for an investment decision. Consult an advisor for your personal situation.
Indices mentioned are unmanaged, do not incur fees, and cannot be invested into directly.
Past performance does not guarantee future results.