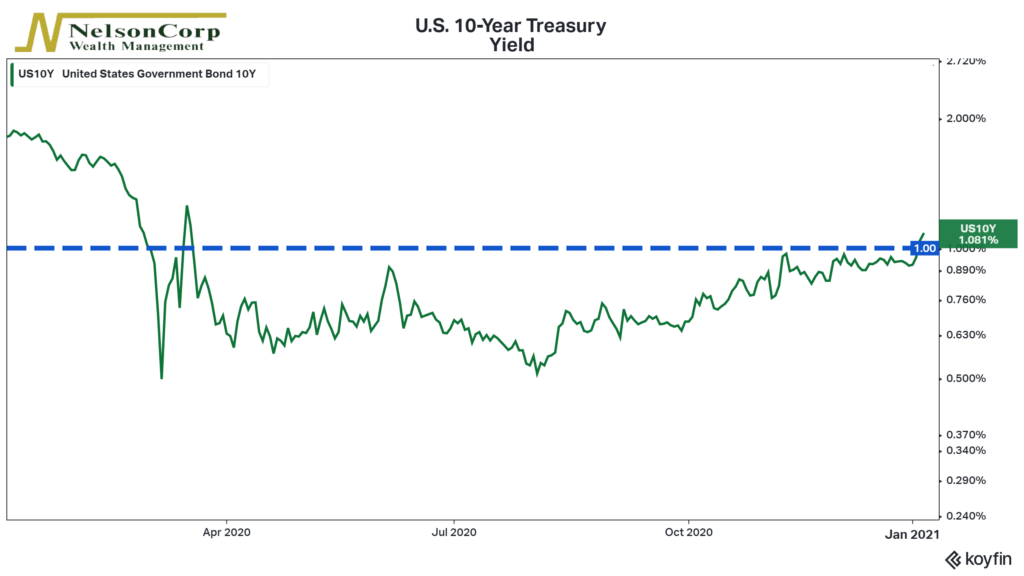
For this week’s featured chart, we look at the yield of the U.S. 10-year Treasury note. This yield represents the return investors require to lend to the U.S. government for the next ten years. The 10-year Treasury yield not only serves as a benchmark for other interest rates in the economy—such as mortgage rates—but also as a guide of investor sentiment about the economy.
For example, the 10-year Treasury yield fluctuates every day as investors form expectations about future economic growth and inflation. Let’s say economic growth is suddenly expected to increase faster than previously thought over the next ten years. Inflation expectations might also go up. This is bad news for bond investors who are lending at a fixed rate because it erodes the purchasing power of their bond’s future cash flows. Consequently, current bond prices will fall, and yields will rise as investors adjust their return expectations.
We saw this play out this week as the 10-year Treasury yield rose above 1% for the first time since March 2020. With Democrats now controlling the presidency, the House of Representatives, and the Senate, investors expect a larger dose of fiscal aid in the future to boost U.S. economic growth. But this could weigh on the bond market through increased debt issuance and higher inflation expectations, hence the rise in the 10-year Treasury rate.
This is intended for informational purposes only and should not be used as the primary basis for an investment decision. Consult an advisor for your personal situation.
Indices mentioned are unmanaged, do not incur fees, and cannot be invested into directly.
Past performance does not guarantee future results.