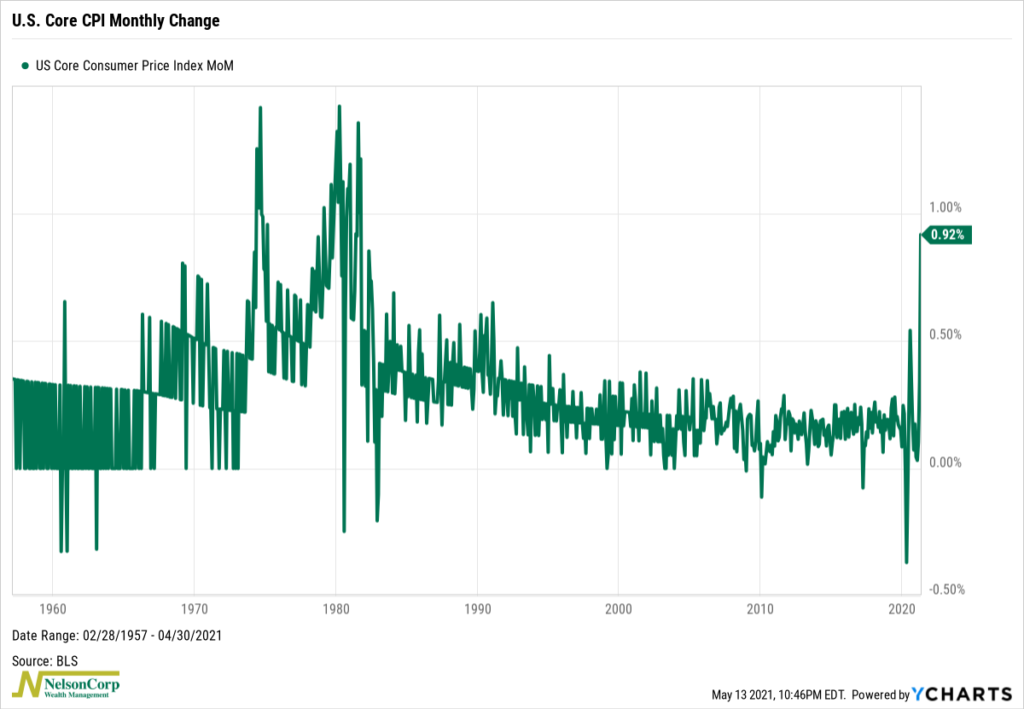
Inflation was the big topic of discussion in the financial world this week. So, for this week’s featured chart, we show the monthly change in the U.S. Core Consumer Price Index (CPI).
The CPI is a commonly followed metric for inflation based on a survey produced by the U.S. Bureau of Labor Statistics. It essentially tracks the prices of a basket of goods and services that a typical U.S. household consumes regularly.
The Core CPI, which out chart above shows, is simply the regular CPI but without food and energy costs. The old joke is that economists don’t think people need to eat or get around. But joking aside, food and energy costs are excluded because these prices tend to fluctuate a lot due to temporary supply-related issues, like drought or hurricanes. Also, they are necessary staples, meaning demand for them doesn’t change much even as prices rise.
This brings us to the 0.92% monthly change in the Core CPI in April, as shown above. This was the biggest monthly change since 1981 and well above the consensus increase of 0.3%. While this price gain was substantial, it is not that unusual from a historical perspective. We just haven’t seen an increase that large in recent years, especially in the Core CPI, so it was quite shocking.
It should be noted, however, that the Covid-sensitive components of the CPI explain most of the gains last month—particularly the massive surge in used car prices. So, it appears that bottlenecks and the goofy effects of the pandemic might be to blame here.
The Federal Reserve focuses more on the “sticky” CPI, which concentrates on the goods and services that change less frequently. It is much more subdued than the “flexible” CPI, suggesting inflation hasn’t yet become “entrenched” in the economy as it did during the 1970s.
To be sure, inflation breadth did rise sharply last month, and some other indicators point to broader price gains. However, it’s just too early to say if stronger price gains will be sustained going forward. The Core CPI is now just slightly above its pre-covid trend.
One thing I know for sure: The next few inflation data releases will be closely watched and highly anticipated. But in the meantime, if you’re curious about how all this might affect your stock investments, check out our recently published Indicator Insights post on our blog where we keep the discussion going.
This is intended for informational purposes only and should not be used as the primary basis for an investment decision. Consult an advisor for your personal situation.
Indices mentioned are unmanaged, do not incur fees, and cannot be invested into directly.
Past performance does not guarantee future results.