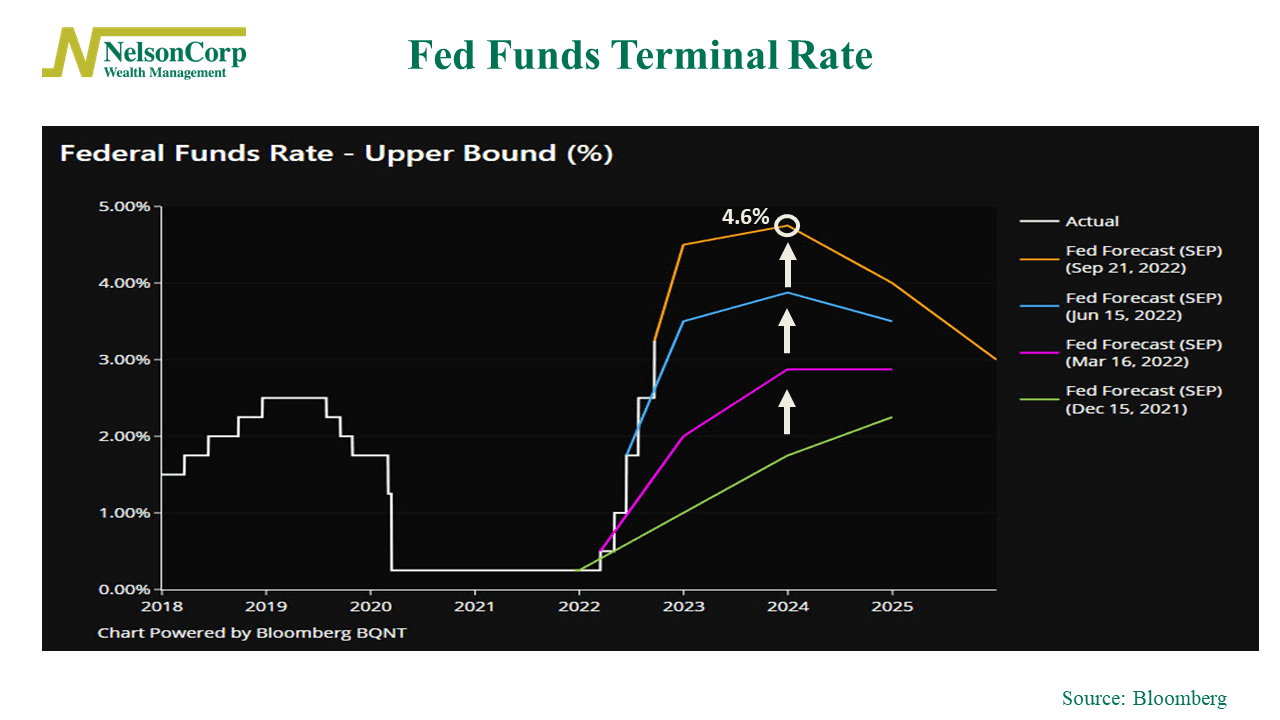
The Federal Reserve held its sixth FOMC meeting this week. One interesting thing to note from the meeting was that the Fed continued to raise its forecast for the fed funds terminal rate.
Shown on the chart above, the terminal rate is the peak spot where the federal funds rate is expected to climb before it starts getting trimmed. Each of the colored lines represents the Fed’s forecasted path of the federal funds rate at past FOMC meetings.
For example, in March 2022, the Fed’s forecasted terminal rate was no higher than 3% (pink line). Fast forward to today, however, and the Fed currently expects the rate to top out around 4.6% sometime next year (yellow line).
This jibes with the theme that the Fed has been playing catch-up all year, trying to reel in inflation. This uncertainty has led to a lot of stock market volatility.
As a bonus, I’ll show another chart that suggests that there is still a lot of uncertainty regarding monetary policy. This next chart is the so-called dot plot or the individual FOMC members’ projections for where they anticipate the fed funds rate to be in the years ahead.
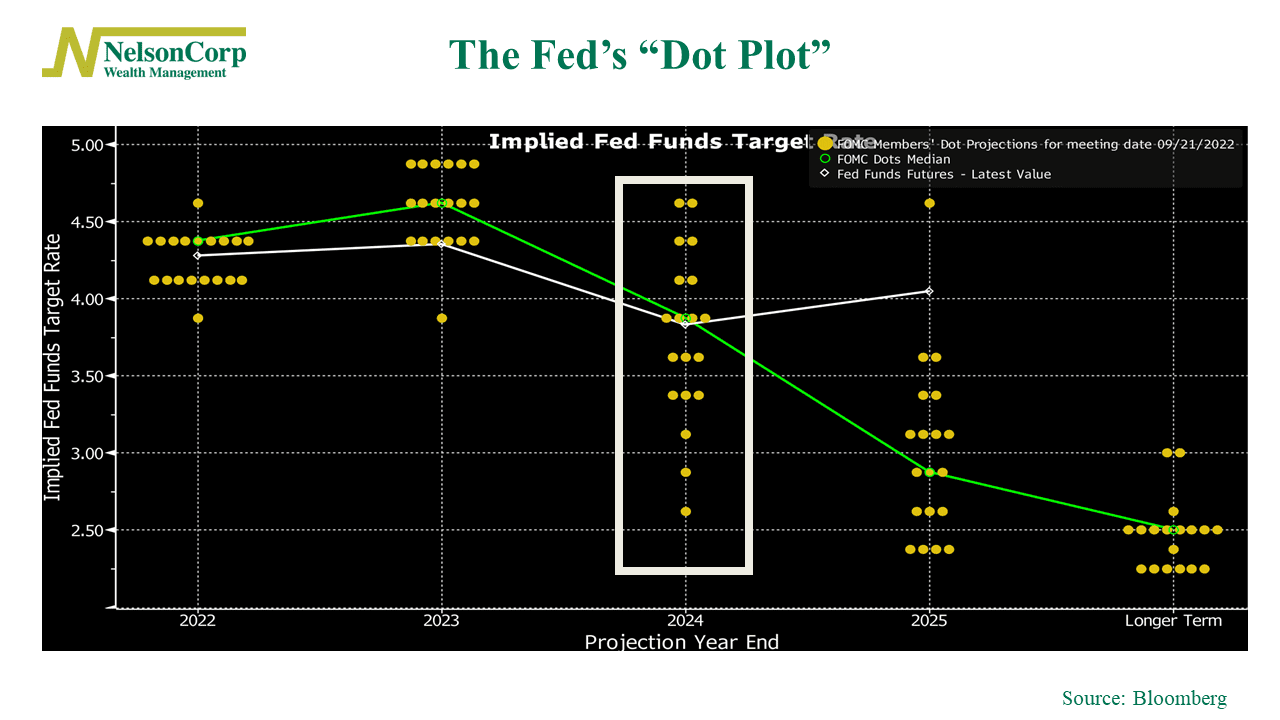
The area that I want to point out is the year 2024. Unlike 2022 and 2023, 2024 shows a lot of variability among members for where they expect the rate to be. In short, it’s all over the map. And this is another reason why we’ve experienced heightened stock market volatility this year.
This is intended for informational purposes only and should not be used as the primary basis for an investment decision. Consult an advisor for your personal situation.
Indices mentioned are unmanaged, do not incur fees, and cannot be invested into directly.
Past performance does not guarantee future results.