The U.S. Census Bureau unveiled a new data product called the Index of Economic Activity (IDEA) this month. The IDEA is a monthly composite of 15 economic data series produced by the Census Bureau. It measures economic activity in various sectors ranging from manufacturing and retail to construction and trade.
The interesting thing about the Census Bureau’s IDEA is that it is presented as what is called a process control chart. This type of chart is helpful because it distinguishes between data variations that are expected versus variations that are unusual and, in many cases, unexpected.
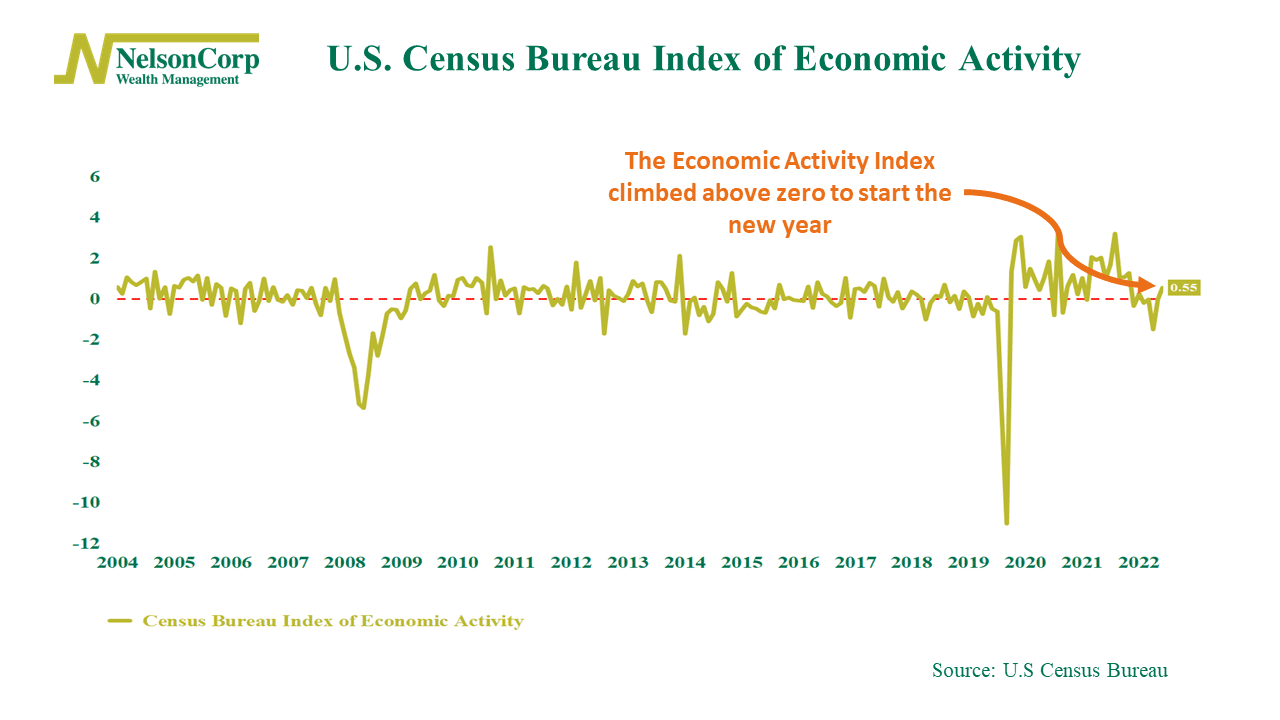
In other words, since the average of the IDEA is centered around zero on the chart, the farther away the measure gets from zero, the more unusual the economic activity is.
The data for the IDEA goes back to about 2004, and you can see on the chart how the measure dropped well below zero during the past two recessions (Great Recession in 2008 and Covid-19 Recession in 2020).
However, what’s interesting about the recent readings is that despite the talk of another recession and a brief dip below zero for the index, the IDEA has since rebounded and is back above zero. A lot of this was driven by strong readings in January from sectors like retail sales and durable goods new orders.
So, the main takeaway is that, according to the Census Bureau’s Index of Economic Activity, the data don’t suggest that we are anywhere near an economic recession right now. That could change as the year progresses, but currently, that’s not the case.
This is intended for informational purposes only and should not be used as the primary basis for an investment decision. Consult an advisor for your personal situation.
Indices mentioned are unmanaged, do not incur fees, and cannot be invested into directly.
Past performance does not guarantee future results.