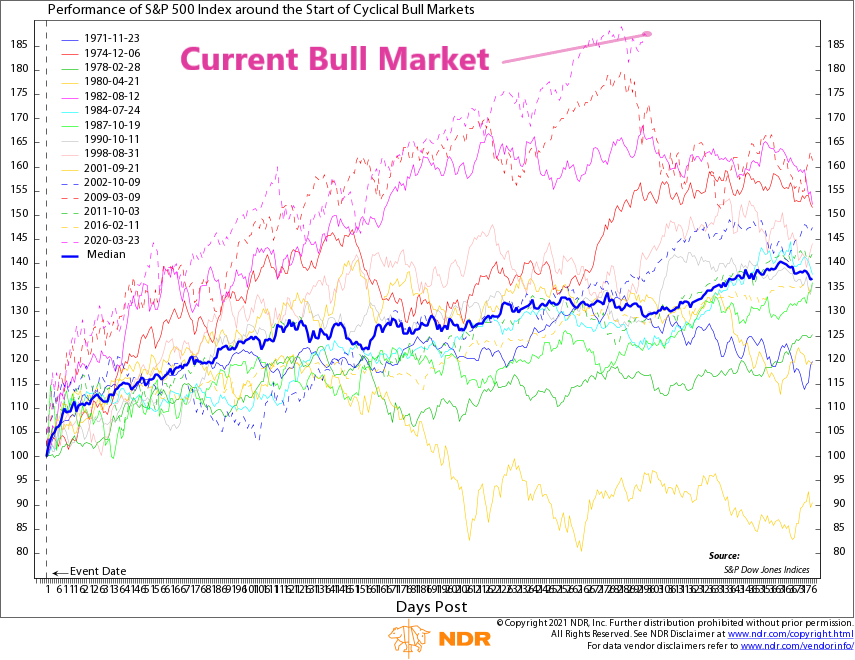
This week’s featured chart shows the performance of the S&P 500 stock index around the start of new cyclical bull markets. There have been 15 new cyclical bull markets (including the current one) over the past 50 years. Each line on the chart represents the stock market’s performance during the first 18 months (378 trading days) of each new bull market. Taken together, this chart illustrates the cyclical nature of new bull markets and helps us glean some insights into the current rally we find ourselves in.
For instance, the strength of this current bull market really stands out. At about 14 months in, this has been the strongest start to a new cyclical bull market on record over the past 50 years. Two other bull markets came close to the current one: the 2009 bull market and the 1982 bull market. However, looking at their performance over the full 18 months, we can see that their performance dropped off during the latter part of the rally, about where we find ourselves today.
Now, that doesn’t necessarily mean that things will play out the same way this go around. In fact, there were other instances in history of bull markets that had strong rallies in the latter part of their cycles. However, their performance earlier in the cycle was usually much weaker, so maybe they were just “playing catch up.” Whatever the case, we think this chart at least paints some context around where we are in this current cycle relative to history.
This is intended for informational purposes only and should not be used as the primary basis for an investment decision. Consult an advisor for your personal situation.
Indices mentioned are unmanaged, do not incur fees, and cannot be invested into directly.
Past performance does not guarantee future results.