The theme of this week’s chart is comparable to your favorite sports team who just completed a “three-peat”—winning three championships in a row—but instead, it’s applied to the S&P 500 stock index.
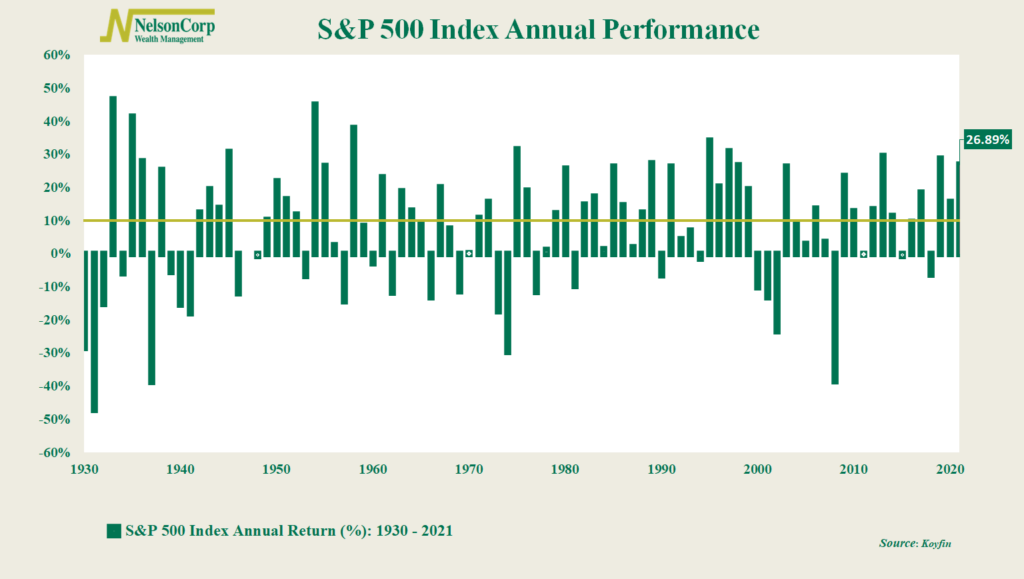
Each green bar on the chart above represents the annual return for the stock index, going back 90+ years, and the gold line demarcates a gain of 10% or more.
This past year, stocks gained roughly 27%. That followed a gain of approximately 16% the year before and 29% the year before that. For those of you counting at home, that’s three years in a row where the S&P 500 stock index gained at least 10% or more on a price-return basis.
That’s rare. It’s happened less than ten other times in the past 90 some odd years of the S&P 500 index.
But what’s even rarer is a double-digit gain four years in a row. That happened once in the ‘40s, once in the ‘50s, and then again during the historical bull run of the late ‘90s.
That means it would be pretty remarkable to see another double-digit gain for the S&P 500 in 2022. It could certainly happen, but it would be rare.
This is intended for informational purposes only and should not be used as the primary basis for an investment decision. Consult an advisor for your personal situation.
Indices mentioned are unmanaged, do not incur fees, and cannot be invested into directly.
Past performance does not guarantee future results.