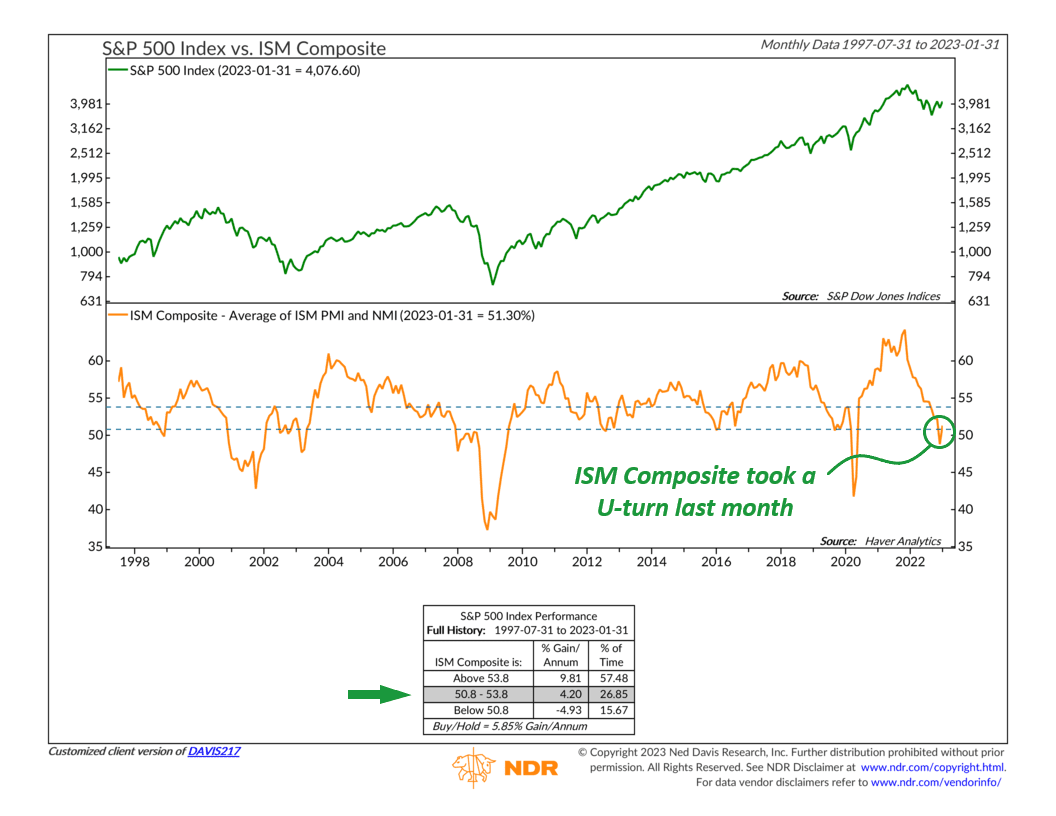
This week’s featured chart shows that a key indicator of the economy’s strength took a sharp U-turn last month. The ISM Composite indicator rose to 51.3% in January, up from the previous month’s reading of 48.8%.
According to the indicator above, this is good news for stock prices because the S&P 500 index has averaged a positive 4% annualized gain when the ISM composite is in this “neutral” middle zone.
What is the ISM Composite? It’s simply an average of the two primary ISM indexes. The first is the ISM Purchasing Manager’s Index, which measures economic strength in the manufacturing sector. And the other is the ISM Non-Manufacturing Index, which measures economic strength in anything that isn’t considered manufacturing—such as services.
The interesting thing to note about the recent strength in the ISM Composite is that it was due to the services sector. The ISM index for services surprised to the upside in January, surging to 55.2%, whereas the manufacturing index fell to 47.4%.
The takeaway? While the data support the thesis that the manufacturing sector is experiencing a mild downturn in economic growth, the data suggests that the services sector—which is a much larger component of overall economic growth—is still holding up.
This is intended for informational purposes only and should not be used as the primary basis for an investment decision. Consult an advisor for your personal situation.
Indices mentioned are unmanaged, do not incur fees, and cannot be invested into directly.
Past performance does not guarantee future results.