When we model intermediate-term stock market risk, we break up the model into three major categories: Price Movements, Investor Sentiment, and the Economic Environment. Each of these three major categories is comprised of six sub-composites each (for a total of 18 sub-composites). This week, I want to focus on one of the sub-components in the Investor Sentiment category: the Surveys/Polls Composite.
The Surveys/Polls Composite consists of six separate indicators that each measure some sort of poll or survey that explicitly asks investors their thoughts about the stock market. For example, two of the six indicators involve the American Association of Individual Investors (AAII) sentiment poll, which is a weekly survey that asks 125 individual investors whether they are bullish, bearish, or neutral on the direction of the market over the next six months. Historically, when the majority of the answers swing too far in one direction, the majority tends to be wrong.
That’s the overall theme of the Investor Behavior category of the model in general and the Surveys/Polls Composite in particular. We want to go against the grain when the crowd’s opinion gets too extreme—since, historically, these are the times when stock market risk is the greatest.
The past few months are a great example of this concept in action.
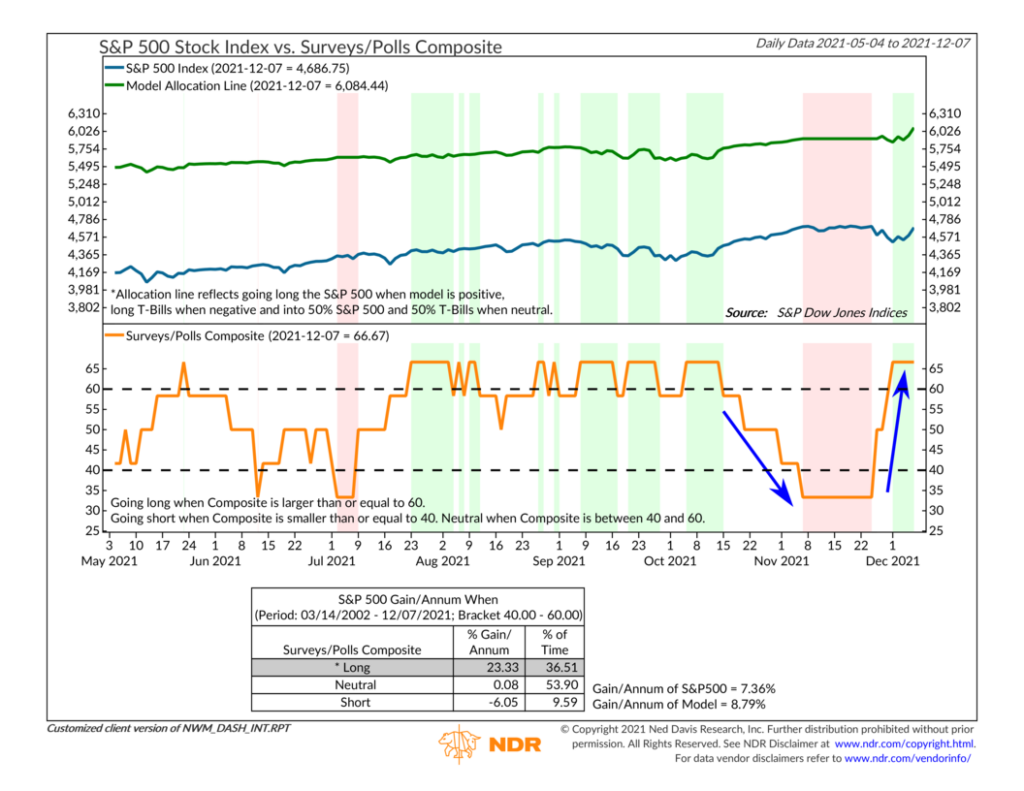
In our chart above, we show the reading of the Surveys/Polls Composite as the orange line in the bottom clip of the chart. (The blue line in the top clip is the S&P 500 stock market index, and the green line is the theoretical performance of the index if the model signals were followed). When the composite reading gets high (above the upper dashed line), it means the majority of the survey/poll indicators are showing readings of extreme pessimism, which we take to be a bullish sign (i.e., we are being contrarian). And the same is true in reverse: when the composite reading gets low, it’s a sign of widespread optimism—a bearish signal in our view.
Looking at the chart, you can see that sentiment among investors was somewhat downbeat from August to about mid-October this year, hence the high (positive) readings from the composite during this time. However, that pessimism had finally given way to extreme optimism by November. Investors were saying they were all-in on stocks. And sure enough, the composite reading dropped to a negative signal just in time for the most recent sell-off.
But then, the reading shot back up into a positive zone as investors’ moods fell back to extreme pessimism. That positive signal coincided with the rebound in stock prices this week.
This is precisely the type of response we expect from this composite. We want it to signal when sentiment has gotten extreme so that our model can move against the grain of the crowd’s extreme opinion. That’s exactly what it did.
This is intended for informational purposes only and should not be used as the primary basis for an investment decision. Consult an advisor for your personal situation.
Indices mentioned are unmanaged, do not incur fees, and cannot be invested into directly.
Past performance does not guarantee future results.