Momentum is an important concept in financial markets. Sure, if you look at a chart of a broad stock market index like the S&P 500, the price seems to squiggle up and down erratically, sometimes with no clear direction as to where it’s headed. But if you zoom out and look at a longer-term history of the chart, you will find extended, sometimes very long trends in the price series. Usually, these trends are preceded by a brief period of consistently strong or weak momentum, where price starts to pick up or lose steam depending on the direction of the new trend.
Our featured indicator above does an excellent job of capturing this idea of consistent momentum. The calculation for the indicator involves two steps. First, we take the 5-day percentage change in global stock prices. In other words, we look at one week of trading and calculate how substantial the price change was, up or down. But then we smooth or take the average of that measure over the past two months. By doing this, we determine whether the week-to-week momentum is staying consistent in recent months—a sign that a new trend is about to begin.
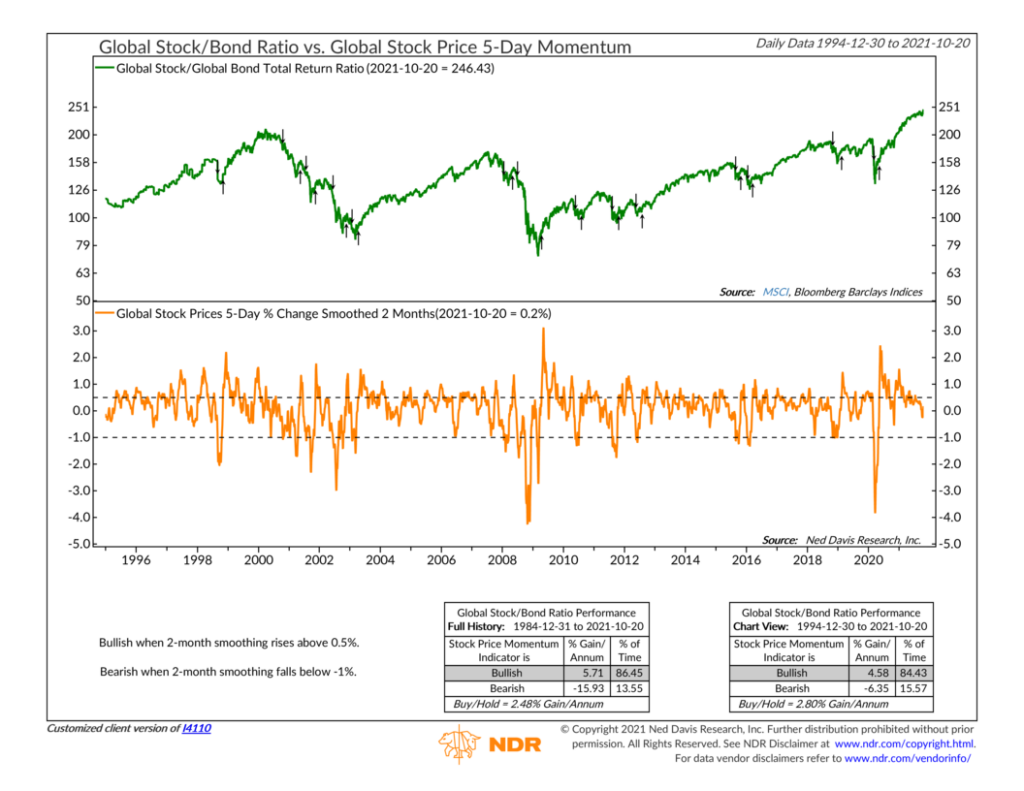
This consistent momentum series is shown as the orange line in the bottom clip of the chart. Historically, when it has risen by more than 0.5%, it has been a sign that global stocks are picking up momentum relative to bonds. However, when the measure has fallen below -1%, global stock momentum is petering off relative to bonds.
You can see these signals visually on the top clip of the chart, where we show the global stock/bond ratio as the green line. A rising line indicates stocks outperforming bonds, and a falling line indicates bonds outperforming stocks. As you can see, the signals have had a pretty good track record, signaling long-term up or down trends shortly after they have begun.
Now, a measure like consistent momentum is not predictive. It’s not going to let you know that a trend reversal will happen before the turning point occurs. Instead, it’s going to wait for confirmation that a new trend has begun, and then it will give the go-ahead. Doing this helps reduce the noise from false starts and stops in the market, and it helps us stay on the right side of the big trends, where the most significant gains (or losses) occur.
This is intended for informational purposes only and should not be used as the primary basis for an investment decision. Consult an advisor for your personal situation.
Indices mentioned are unmanaged, do not incur fees, and cannot be invested into directly.
Past performance does not guarantee future results.