Charles Dickens once wrote, “credit is a system whereby a person who can’t pay, gets another person who can’t pay, to guarantee that he can pay.”
Now that’s a bit cynical, but it does tap into this idea that credit is based on the concept of trust. Can you trust that the person or entity you lend to will ultimately pay you back? That depends on the circumstances. And the level of trust in financial markets waxes and wanes over time; it’s not constant.
I like the analogy used by the economist Alan Blinder. He describes credit as a coward. When times are good, it struts around and talks to everyone. But when times get tough, and risk rises, it runs away and hides.
To visualize this phenomenon, we like to look at an indicator that measures credit spreads.
What is a credit spread? It’s the difference in the interest rate between risk-free bonds—like the kind the U.S. government issues—and more risky bonds, like the ones issued by a public corporation.
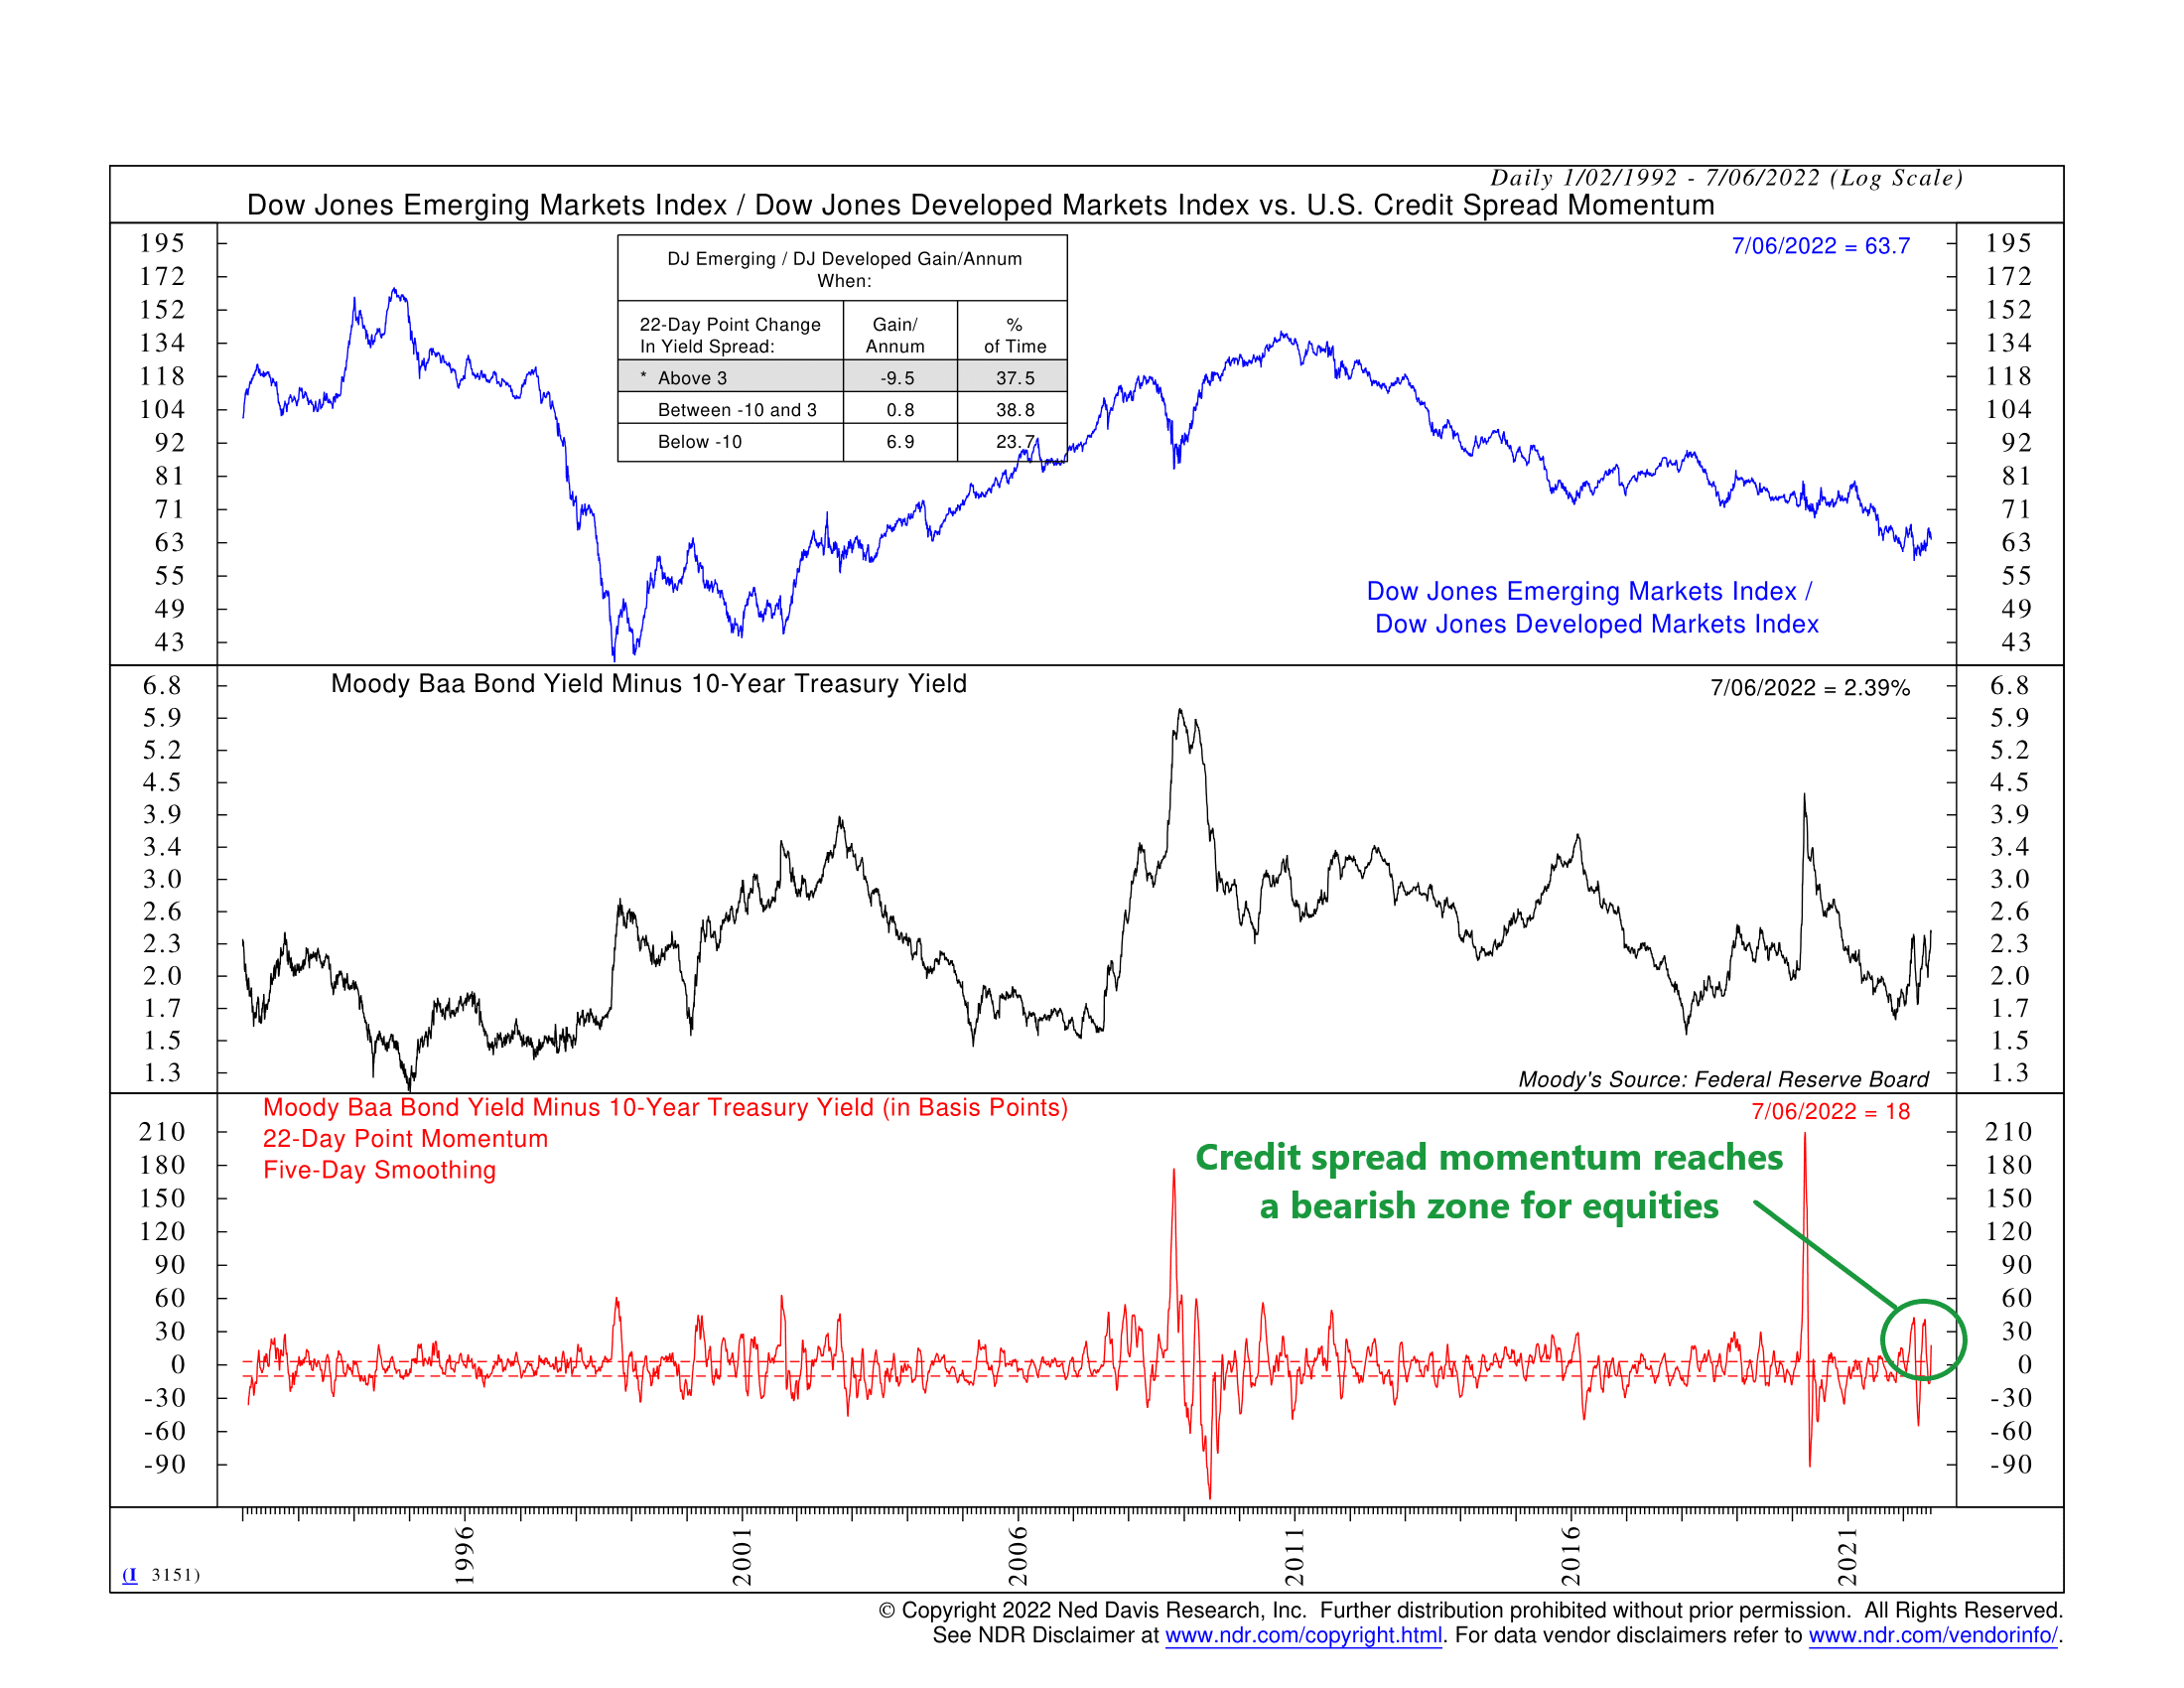
In the middle clip of the chart above, we show the yield or interest rate on a Moody’s Baa-rated corporate bond minus the yield on the 10-year U.S. Treasury note. When this line is rising, it means the yield on riskier investment-grade corporate bonds is increasing relative to the yield of the safer government-issued bonds.
Why does this happen? Because, again, credit is a coward. When uncertainty in financial markets rises, and investors get nervous, they sell riskier corporate bonds and buy haven assets like U.S. Treasuries. This pushes the yield of corporate bonds up and the yield of government bonds down, resulting in a wider or higher credit spread.
In other words, credit spreads measure risk tolerance. All else equal, a higher credit spread means lower risk tolerance and vice versa.
To put more meat on the bones, this indicator also calculates the 22-day (1-month) change in the credit spread in basis points. This is shown as the red line on the bottom clip of the chart. When this measure spikes, it’s a sign that investors’ tolerance for risk is falling. In this type of environment, other risk assets—like stocks—also tend to suffer.
You can see that this measure has spiked during past stock market crises. There were quite a few spikes during the dot-com crash in the early 2000s, a big one during the 2008 financial crisis, and the biggest one of all happened during the covid-crash in 2020.
We are also seeing some pretty large jumps this year as well, which is becoming more of a concern. Although Treasury yields—the safe asset of the equation—have risen pretty drastically this year due to the Fed raising rate to stem inflation, we’ve also started to see lower-quality corporate bond yields rise even faster in recent months.
To be sure, it hasn’t been a massive blowout like some of the past downturns. But the momentum is high enough to put the indicator into a bearish zone for equities. Add that to the fact that fears of a recession are currently swirling around, and this indicator becomes a good one to watch for signs that cracks are appearing in the system and investor sentiment is souring.
This is intended for informational purposes only and should not be used as the primary basis for an investment decision. Consult an advisor for your personal situation.
Indices mentioned are unmanaged, do not incur fees, and cannot be invested into directly.
Past performance does not guarantee future results.