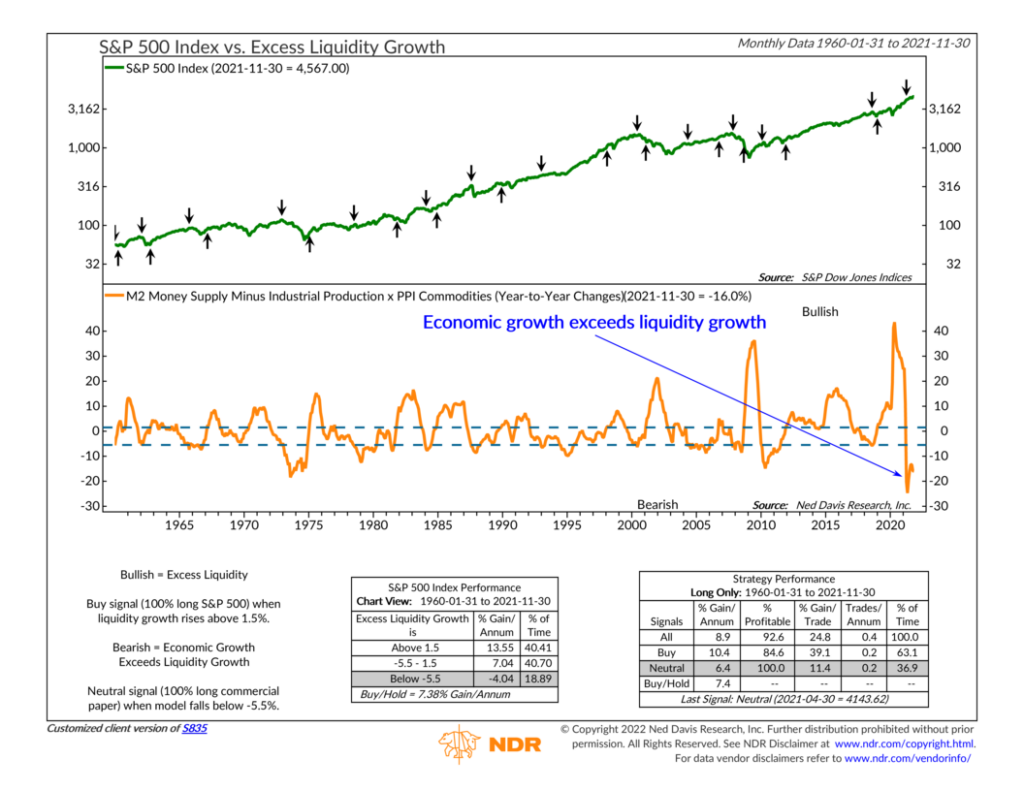
The one thing made apparent last year is that liquidity matters to the stock market. By liquidity, we mean the amount of available money sloshing around the economy; when it’s excessive, it tends to find its way into financial assets—like stocks.
One of the more popular ways of measuring liquidity is to find the 12-month change in the M2 money supply, a commonly used measure of money available for spending. When the amount of M2 money rises rapidly compared to a year ago, there’s a good chance some of that extra cash will find its way into the stock market. Historically, there has been a strong tendency for financial assets—such as stocks and housing—to rise following an increase in the money supply.
But there’s a problem. The economy needs some of that extra money, too. The economy tends to use up more money as it grows. If economic growth far exceeds the growth rate of liquidity, a rapidly growing economy is siphoning liquidity away from financial assets. In this scenario, all the extra cash flows to fuel the economy, which places downward pressure on the stock market. Indeed, many of the major stock market downturns in the past occurred when economic growth outstripped liquidity growth.
So how do we account for all this? Our featured indicator above solves the problem in a clever way. The orange line represents the annual growth of industrial production and the commodity price component of the Producer Price Index (PPI) subtracted from the 12-month change in the M2 money supply. Industrial production and PPI commodities represent the economy (excluding inflation) and what is produced with available money. So, when we multiply the two of them together and then subtract that from the money supply, we get a measure of excess liquidity in the economy.
Historically, we’ve found that the best conditions for stocks occur when the indicator rises above the top bracket. Since the 1960s, the S&P 500 stock index (represented by the green line) has returned roughly 13.5% per year, on average, when excess liquidity is higher than the top bracket. However, on average, when excess liquidity falls below the lower bracket, stocks have returned about -4% per year. (For reference, buying and holding the S&P 500 would have returned about 7.4% per year over that same period).
So that’s an indication of just how powerful this indicator can be. The evidence demonstrates that money provided by the Fed above what is needed for economic growth and inflation is bullish for stocks. In contrast, money insufficient to cover inflation and growth can hurt stocks.
Therefore, by assessing the relationship between the monetary and economic environments, this indicator can help us improve market outcomes in the long run.
This is intended for informational purposes only and should not be used as the primary basis for an investment decision. Consult an advisor for your personal situation.
Indices mentioned are unmanaged, do not incur fees, and cannot be invested into directly.
Past performance does not guarantee future results.