Here’s an unusual argument you may have never heard before: good investing is like being a teenager. What do I mean? Well, teenagers tend to follow the latest trends (social, fashion, etc.). They do this to be cool. Now, whether that is good or not for teenagers is debatable. But, when it comes to investing, following the trend can be cool for investors.
Why? Because humans are herdlike animals. We like to follow the crowd. Some have even described us as the ape who imitates. And because of this, we tend to invest our wealth in a way that produces trends in financial assets.
Of course, this can lead to financial bubbles. History books are full of examples. But here’s the thing: If we do it in an intelligent and thoughtful way, we can take advantage of these trends in the market to make money and manage our risk exposure all at the same time.
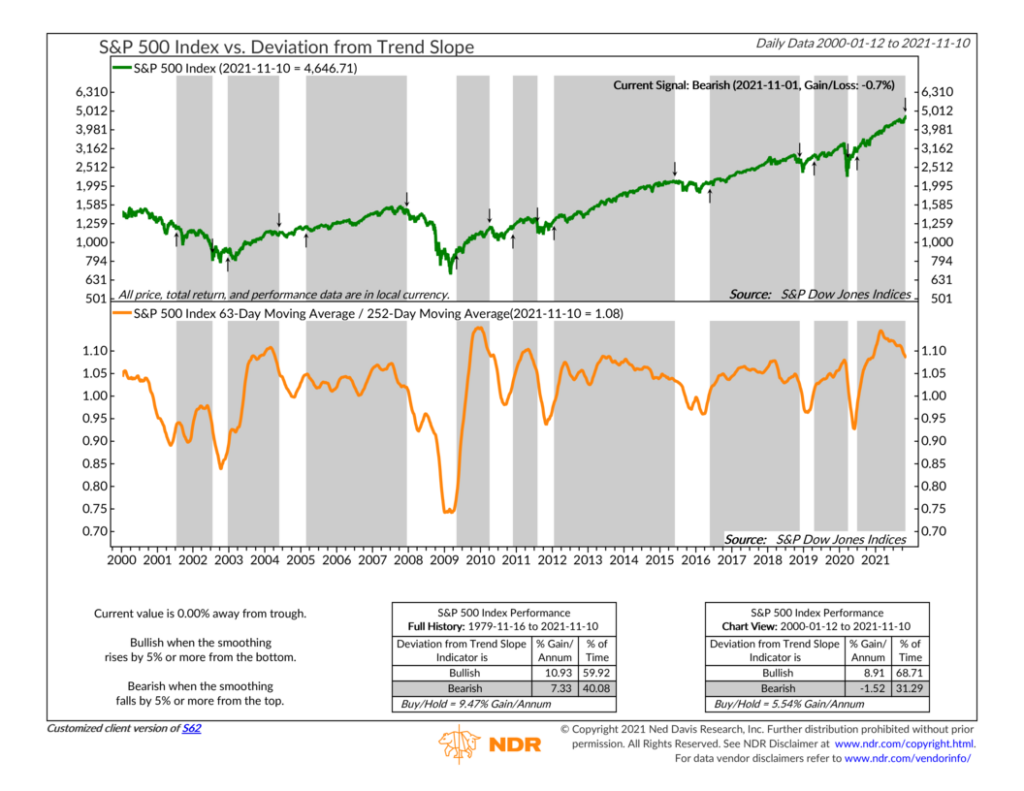
Here’s one way that we do it. The indicator above is what we call a deviation-from-trend indicator. It takes the average price of the S&P 500 stock index over the past three months (63 trading days) and divides it by the average price of the index over the past year (252 trading days).
This produces the orange line on the chart. When the line is going up, it means prices in the near term are rising faster than their long-term average. This usually occurs when the market is heating up and a new trend is forming. However, when the line is falling, it generally means the market is cooling off and a downward trend in prices is developing.
Historically, looking at the past 20 years, we’ve found that the best buy signals are generated when the deviation-from-trend line rises by 5% or more from a recent bottom. The S&P 500 index (represented by the green line on the top of the chart) has produced an average annualized gain of almost 9% per year after this type of buy signal. And, on the flip side, when the line has fallen by 5% or more from a recent top, the S&P 500 has actually had a negative annualized return.
Overall, this indicator works best in market environments like 2008-2009 and 2015-2016. As the trend became exhausted during these periods, a sell signal was triggered. This would have allowed you to de-risk your portfolio by reducing stock exposure. Then, once the painful selling was over, the indicator produced a buy signal, paving the way for a new upward trend. At this point you could have felt comfortable adding stock exposure back to your portfolio.
This is a valuable tool to have in your toolkit as an investor. It’s this sort of risk management that allows you to sleep comfortably at night, knowing your money is safe. And by following the trend, you’re not just being cool; you’re being smart with your money.
This is intended for informational purposes only and should not be used as the primary basis for an investment decision. Consult an advisor for your personal situation.
Indices mentioned are unmanaged, do not incur fees, and cannot be invested into directly.
Past performance does not guarantee future results.