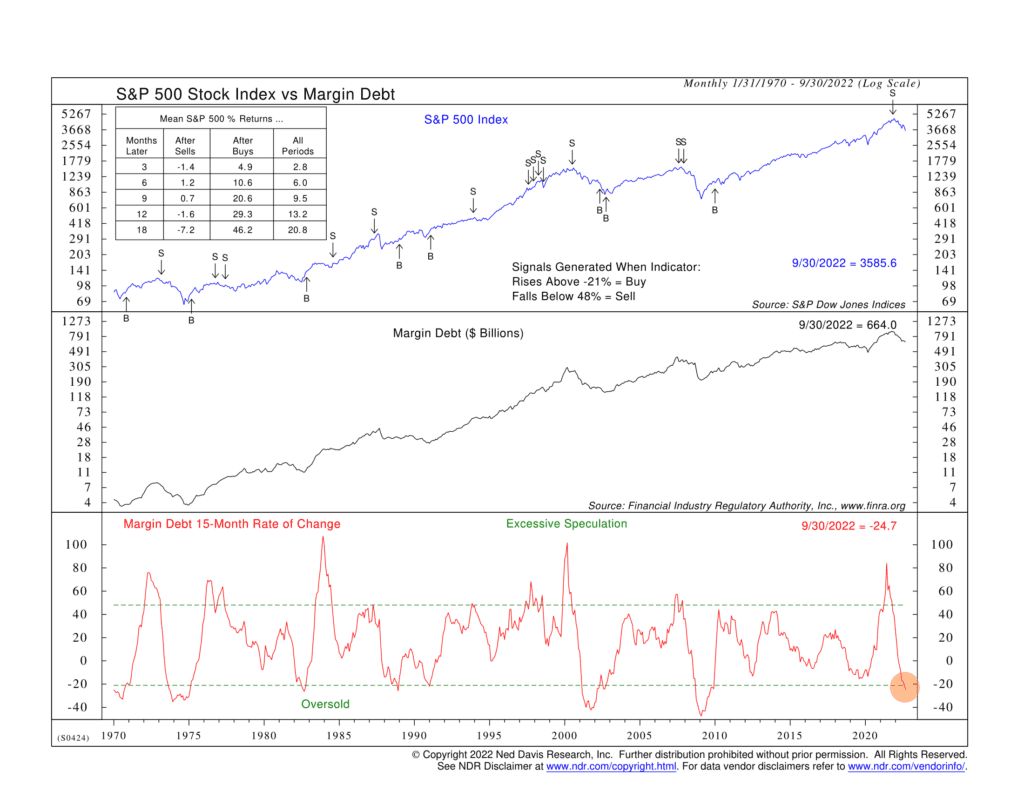
For this week’s indicator, we look at margin debt and how we use it to measure market sentiment.
Margin debt is a measure of the amount of stock market borrowing that investors are doing with their brokerage accounts. When there is an increase in margin debt, it shows that investors are more willing to take on risk, and prices continue to rise. On the other hand, when there is a decrease in margin debt, it’s a sign that investor sentiment has turned bearish and prices begin to fall.
In the middle portion of the chart above, we show the total amount of margin debt (in $ billions) over time, going back to the 1970s. As you can see, it generally goes up over time; but there are many instances when it falls. We’ve found that looking at the rate of change of margin debt over a period of about 15 months has been a great way of determining when market sentiment is shifting, thus making this metric an excellent leading indicator of stock market changes.
The 15-month rate of change calculation is shown as the red line on the bottom part of the chart. Trend reversals in the stock market tend to occur when this measure falls below 48% or rises above -21%. Specifically, a fall below 48% triggers a sell signal, and a rise above -21% generates a buy signal.
The performance box on the top left of the chart shows how this indicator has performed historically. For example, 12 months later, the stock market is up about 29% after a buy signal but down 1.6% after a sell signal. This compares to a 13% average gain during all 12-month periods.
The latest signal came at the beginning of the year when a sell signal was generated. The 15-month rate of change of margin debt had reached historically excessive levels and then reversed. This was a sign of slowing investor confidence, which tends to precede price declines.
Today, however, margin debt growth has slowed considerably, and based on the indicator, it is currently in the historically oversold zone. The key will be to look for margin debt momentum to reverse from here and move higher, at which point this indicator will generate a buy signal.
The bottom line? Margin debt increases when the stock market becomes overbought and decreases when it becomes oversold. The most recent peak in margin debt momentum was reached at the beginning of the year when the stock market was overbought, and prices have declined ever since. Therefore, a potential trough and reversal in margin debt momentum could be a good sign that the market is close to bottoming.
This is intended for informational purposes only and should not be used as the primary basis for an investment decision. Consult an advisor for your personal situation.
Indices mentioned are unmanaged, do not incur fees, and cannot be invested into directly.
Past performance does not guarantee future results.
