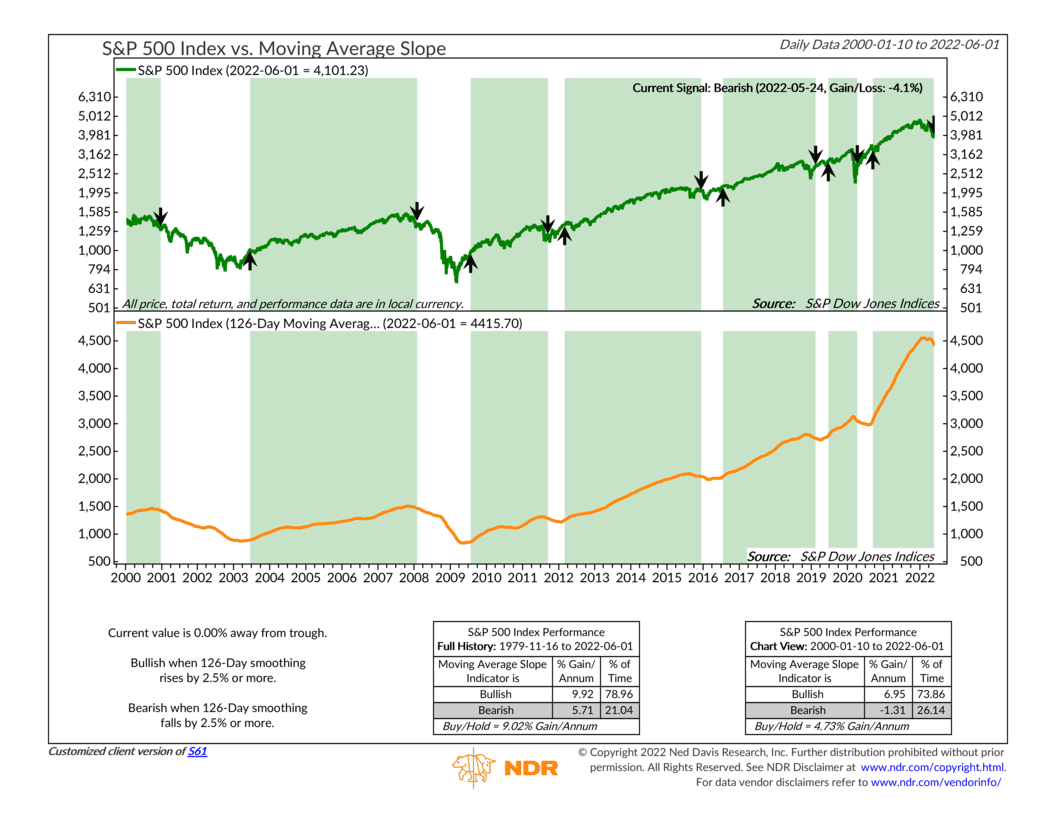
For this week’s Indicator Insights, we highlight a price-based indicator that measures the intermediate-term trend of the stock market. Specifically, it measures the 126-day (6-month) moving average of the S&P 500 stock market index, shown as the orange line on the bottom clip of the chart. The signals are generated when the indicator rises by 2.5% or more from a previous bottom—triggering a buy signal—or when the indicator falls by 2.5% or more from a previous peak—triggering a sell signal. The areas shaded in green indicate bullish periods, whereas the unshaded areas show bearish periods.
The S&P 500 stock market index is shown as the green line on the top clip of the chart. As the performance boxes at the bottom of the chart show, the S&P 500 has returned nearly 10% per year, on average, after a buy signal from this indicator, compared to under 6% after a sell signal. Since 1980, the S&P 500 has returned about 9% per year, so this indicator adds some value over the longer term when the buy and sell signals are followed.
Why does this work? Because history has shown that stock prices tend to go through cycles, traveling in trends over time that are either up (bull market) or down (bear market). By measuring the average price of the stock market over the past six months, we get a good sense of where the current trend is, well, trending. If we can get on the right side of the longer-term trend, we can capture the big moves in the market and avoid the short-term squiggles or noise.
We call this indicator a moving average slope because it measures the slope or steepness of that orange line, which represents the 6-month average of stock prices. When the slope finally turns upward, it’s a sign that stock prices have embarked on a longer-term uptrend. But when it rolls over and starts heading down, it’s a sign that the trend has broken down and stock prices are generally heading lower. This has happened this year, thus the reason for the recent sell signal last month.
I would note that the most value from this type of indicator comes in periods like 2001-2003 and 2008-2009 when the market is in a bear market and traveling in a downtrend. You can preserve your capital better in these times by moving some of your portfolio out of riskier stocks and into safer assets like bonds or cash.
However, this indicator is prone to whipsaws. In other words, sometimes the market gives a head fake after a sell signal, reverses course, and heads higher. The most recent example was 2020 when the market moved much too fast for this type of indicator to give a timely signal. For this reason, we employ multiple trend-based indicators in our analysis that use various time frames, ranging from the short to the longer term. We’ve found that this weight-of-the-evidence approach is a better strategy for managing risk than relying on just one or two indicators.
At the end of the day, this indicator does its intended job. It measures the stock market’s intermediate- to long-term trend and determines when that trend is generally moving up or down. Like a skier, it surveys the terrain and determines the steepness of the slope of the market. And if the hill is too steep, it reminds us that it’s okay to take the bunny hill from time to time.
This is intended for informational purposes only and should not be used as the primary basis for an investment decision. Consult an advisor for your personal situation.
Indices mentioned are unmanaged, do not incur fees, and cannot be invested into directly.
Past performance does not guarantee future results.
