You can describe the idea of a “thrust” in numerous ways. A sudden or violent lunge comes to mind, like the propulsive force produced by a rocket or a jet plane. But in the world of finance, we have a more technical definition: a lot of stocks going up in a short period of time. OK, there’s a little more to it than that, but the basic idea still holds.
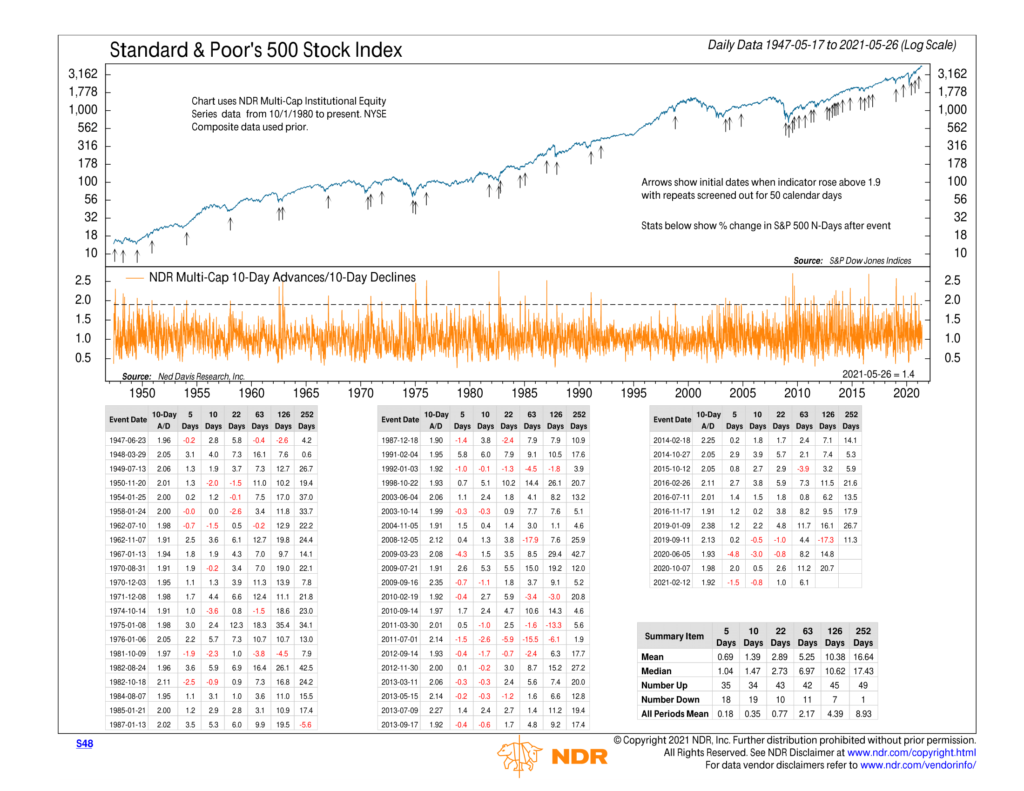
Our featured indicator this week is a great example of what I’m referring to. We call it a 10-day Advance/Decline thrust indicator. To create it, we take the total number of stocks advancing (increasing) in price over the past ten days and divide it by the total number of stocks declining in price over those same ten days. This produces a ratio (the orange line on the chart) that goes up when more stocks are increasing than are decreasing and falls when more stocks are decreasing than are increasing.
Clearly, a rising line is better. But historically, we find that things get interesting once the line exceeds a ratio of 1.9 (which means that for every stock that decreased in price over the past ten days, there were almost two or more that increased in price). Once this threshold is breached, stocks have registered above-average gains over various time periods a full year later.
For example, there have been a little more than 53 of these breadth thrusts over the past 74 years. The median gain for the S&P 500 stock index was nearly 7% over the next three months, 10.6% over the next six months, and nearly 17.5% a full year after the initial thrust signal.
Generally, we tend to see breadth thrusts at the beginning of bull markets after stocks have become oversold. Gains tend to come fast and furious off these bottoms, hence the description of a thrust.
But sometimes, we get them a bit later in the bull market, like the one we got in October of last year and February of this year. Gains were strong three months later for each signal, which is the time frame we feel is the most optimal to measure a thrust over.
Stocks rallied about 6% during the three months after the latest thrust signal in February. However, that signal has expired, so we should expect more neutral (average) gains going forward unless we see another thrust signal triggered.
This is intended for informational purposes only and should not be used as the primary basis for an investment decision. Consult an advisor for your personal situation.
Indices mentioned are unmanaged, do not incur fees, and cannot be invested into directly.
Past performance does not guarantee future results.
