Volatility, in plain terms, is a measure of how much prices move up and down over a given period. But there are many ways to measure volatility. For our featured indicator this week, we evaluate it using something called an Absolute Breadth Index.
The Absolute Breadth Index is unique because it measures volatility levels in the market regardless of price direction. In other words, it ignores the direction in which prices are going. This is accomplished by taking the absolute value of the weekly number of stocks advancing in price minus the weekly number of stocks declining. The absolute value means it ignores any negative signs, thus treating all numbers as positive (or zero).
For example, let’s say 10 stocks went up in price last week, and 90 stocks went down in price. The difference between the two is -80, but the absolute value takes out the negative sign and makes it a positive 80.
Now, because the number of stocks listed on the stock exchange changes over time, we must standardize this measure. To do this, we divide the absolute breadth number by the total number of stocks traded that week. In our example above, we would divide 80 by 100 to get 80%, which is a high level of volatility.
By contrast, if 40 stocks advanced in price and 60 stocks declined in price, the difference in absolute breadth would be just 20. Divide that by 100, and you get 20%, which is a relatively low level of volatility.
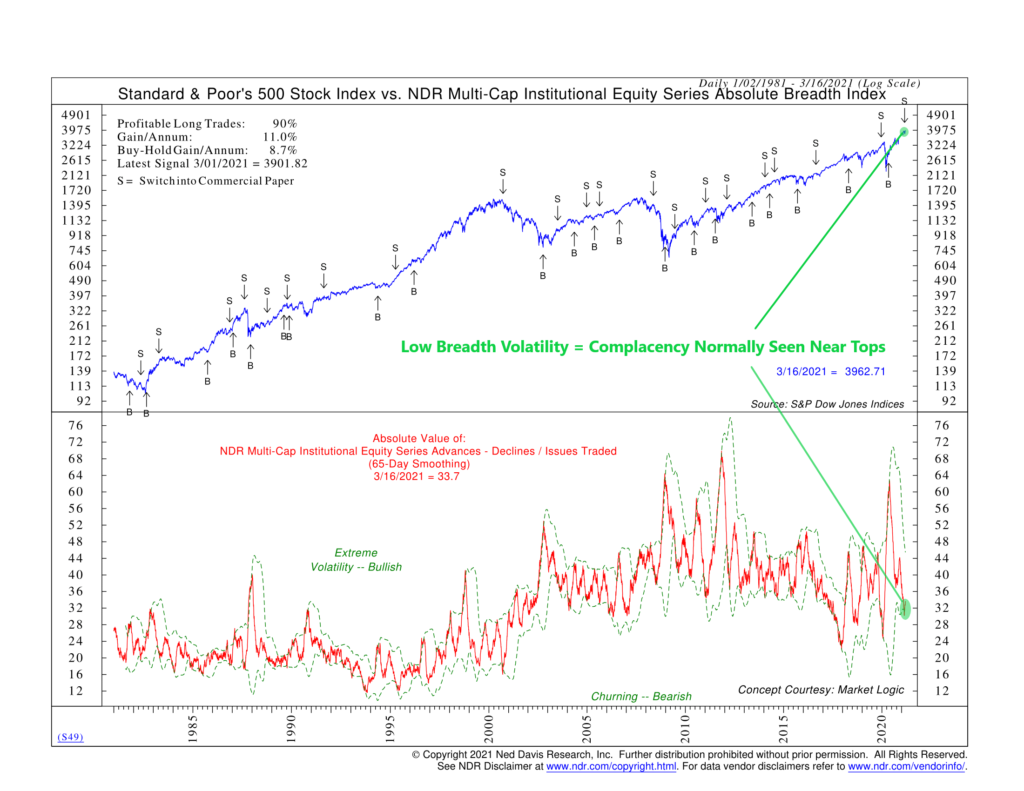
So that’s the Absolute Breadth Index in a nutshell. High readings tend to occur when the market is volatile, generally when selling has reached a climax. Whereas low readings tend to mean the market is churning and no meaningful changes are taking place, a condition we typically see around a market top when complacency is high.
To take this one step further, our indicator above applies a 65-day moving average to the absolute breadth reading and then plots standard deviation brackets around it. When the reading gets so high that it climbs above the upper bracket and reverses, it triggers a buy signal. But when it gets so low that it falls below the lower bracket and reverses, it triggers a sell signal.
Historically, if you would have followed this strategy, it would have produced average annual gains of 11% versus a buy-and-hold gain of 8.7%. This is a nice outperformance, and amazingly, 90% of the buy signals would have been profitable!
In the end, the Absolute Breadth Index doesn’t care about which way the market is moving, up or down; it simply cares about how volatile the market’s breadth is. Because of this, it’s earned the nickname the “Going Nowhere Indicator.” Since it measures stock market participation, it can help us determine whether the market activity (or lack thereof) is a sign of where the market is headed.
This is intended for informational purposes only and should not be used as the primary basis for an investment decision. Consult an advisor for your personal situation.
Indices mentioned are unmanaged, do not incur fees, and cannot be invested into directly.
Past performance does not guarantee future results.