This week’s featured indicator focuses on the High Quality/Low Quality Index. This is what we call a “relative strength” indicator because it takes the performance of one stock index and divides it by another to get a relative strength line. When the line is going up, the first index is outperforming, but when the line is moving down, the second index is performing better. In this case, we are comparing an index of high-quality stocks to an index of low-quality stocks.
But, you might be asking, what do we mean by high and low quality? Well, some companies have a stable history of persistent profitability, relatively low debt levels, efficient capital use, and robust earnings and dividends growth. We call these high-quality companies. By contrast, other companies don’t exhibit these high-quality characteristics, so we call these low-quality companies.
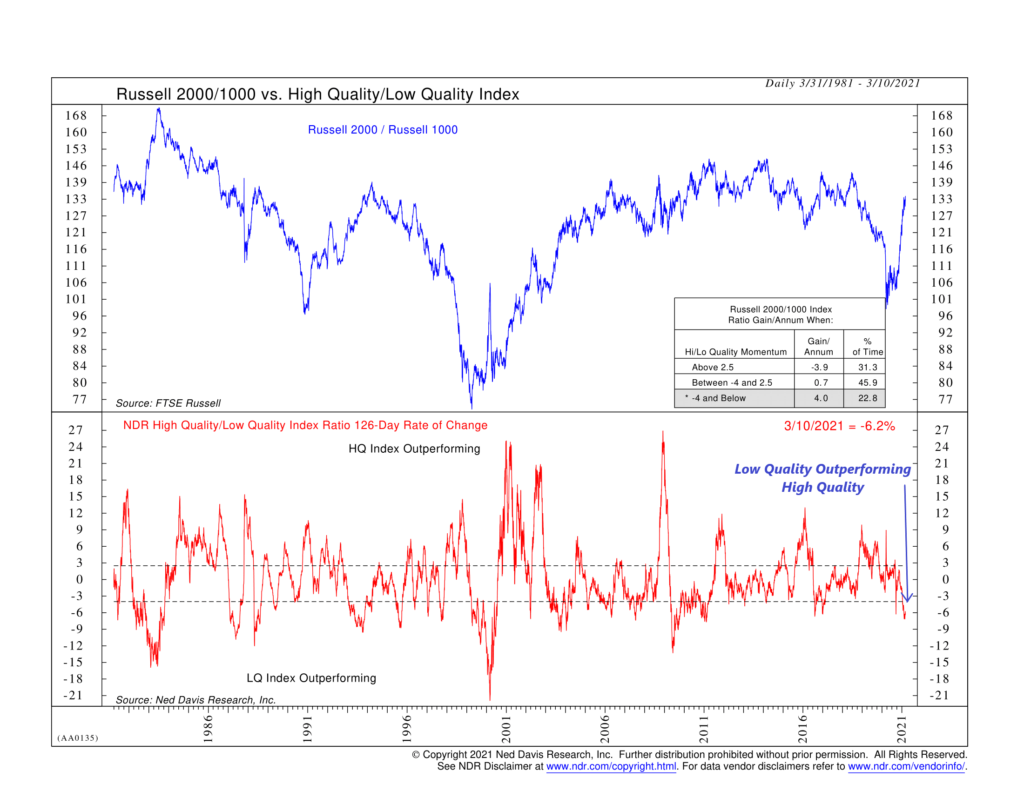
Sometimes the stocks of high-quality companies do better, while other times, low-quality stocks outperform. To visualize this, the indicator above takes the High-Quality Index and divides it by the Low-Quality Index to get a relative strength line. It then calculates the return of that line over the past 126 trading days or roughly six months. This is the red line in the bottom half of the chart. When it’s going up, high quality is outperforming; when it’s going down, low quality is outperforming.
The blue line on the top half of the chart is another relative strength line, measuring the Russell 2000 Index divided by the Russell 1000 Index. The Russell 2000 Index represents some of the smallest 2,000 stocks in the United States, which tend to be riskier than the larger stocks in the Russell 1000 Index. As before, when the line is going up, small-cap stocks are outperforming. And when the line is going down, large-cap stocks are doing better.
What we find is that when high-quality stocks are outperforming low-quality stocks, as measured by the 126-day rate of change of the High Quality/Low Index (red line) rising above 2.5%, the large-cap stocks in the Russell 1000 Index do better than the small-cap stocks in the Russell 2000 Index. But when the 126-day rate of change of the High Quality/Low Index falls below -4%, the Russell 2000/Russell 1000 relative strength line (blue line) rises, meaning the riskier small-cap stocks are outperforming large-cap stocks.
This is what we’ve seen more recently in the stock market. The 126-day rate of change of the High Quality/Low Quality Index recently fell to -6.2%, meaning low-quality stocks have done exceptionally well relative to high-quality stocks. When we look at the Russell 2000/Russell 1000 line at the top, we see that it has surged dramatically in recent months, a sign that investor’s risk appetite for small-cap stocks is high.
Bringing it all together, we use this indicator to tell us when the environment is favorable for stocks in general. If investors are putting capital to work in smaller, riskier companies, then the overall backdrop for stocks is probably bullish. But when only the highest quality stocks are doing well, it’s likely a poor time to be fully invested in the broader market.
This is intended for informational purposes only and should not be used as the primary basis for an investment decision. Consult an advisor for your personal situation.
Indices mentioned are unmanaged, do not incur fees, and cannot be invested into directly.
Past performance does not guarantee future results.
