When you buy a stock, you are essentially paying for the earnings that the underlying business generates. If you compare how much a company is earning on a per-share basis relative to how much you pay for it, you get what is called an earnings yield. For example, let’s say you spend $10 for a stock earning $5 per share; the earnings yield would be 50% ($5 per share divided by $10 per share).
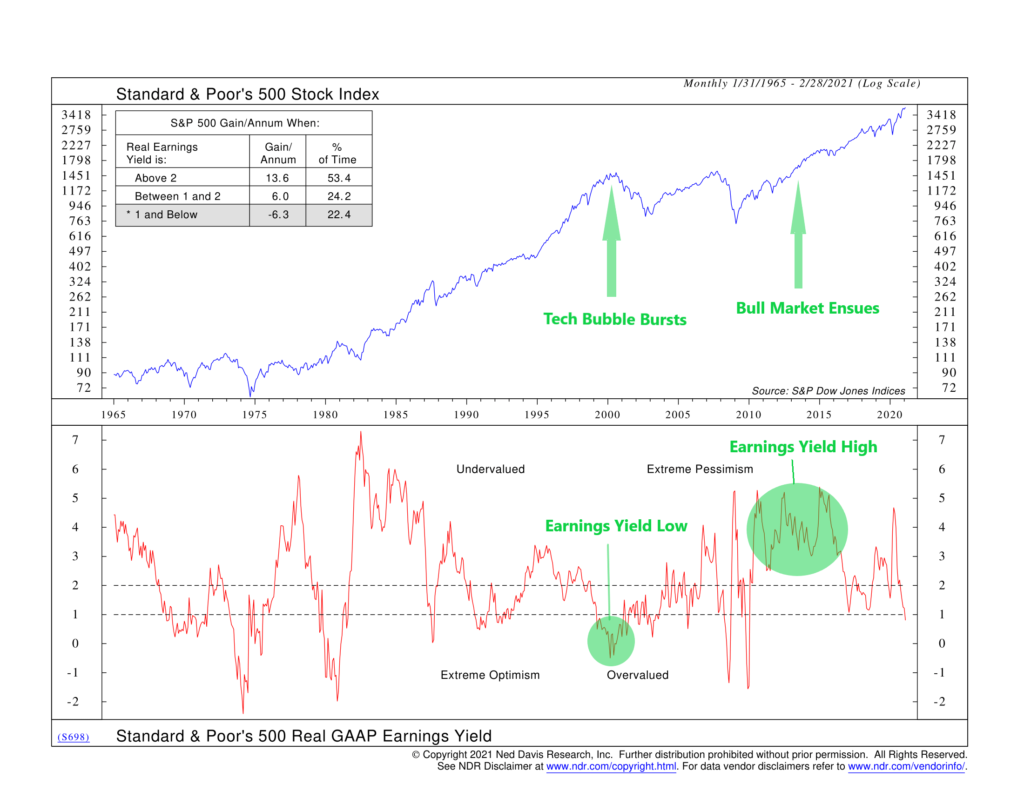
This is what our featured indicator above is showing, but for the S&P 500 index. It takes the last four quarters of reported earnings for all the companies in the S&P 500 and divides that by the index value. It also subtracts out the 12-month percent change in the Consumer Price Index—a standard measure for inflation—to get a real (inflation-adjusted) earnings yield. This is done simply because investors only really care about gains that are over and above inflation.
Historically, the indicator shows stock gains have come in above average when the real earnings yield has been high. We can see why this might be the case if we examine the decade or so following the financial crisis of 2007-2008. Coming out of the crisis, inflation was relatively low, and earnings over the prior 12 months were coming in high relative to where stock prices were—as many investors were probably still scarred by the events of the crisis—so the real earnings yield was quite high. Consequently, stocks had to play catch up over the next decade as share prices rose, multiples expanded, and confidence came back.
On the other hand, when the real earnings yield has been historically low, stock returns have been weak. The 2000 tech bubble is a good analog for this dynamic. The year-over-year CPI inflation rate rose from a low of 1.38% in March 1998 to 3.76% in March 2000. More so, while S&P 500 earnings per share grew around 20% during that same two-year period, the S&P 500 index rose around 40%. The result was a low real earnings yield that coincided with the bursting of the tech bubble. Prices had become so disconnected from the underlying companies’ earnings that the S&P 500 was still more than 20% off its mid-2000 peak four years later.
The takeaway is that while it is difficult to use any valuation-based indicator to time the market—including this one—they can still be useful for highlighting when risks have become high or low relative to history.
This is intended for informational purposes only and should not be used as the primary basis for an investment decision. Consult an advisor for your personal situation.
Indices mentioned are unmanaged, do not incur fees, and cannot be invested into directly.
Past performance does not guarantee future results.
