This week’s featured indicator looks at the percentage of stocks on the New York Stock Exchange (NYSE) making new 52-week lows. Since it tracks the percentage of stocks breaking down in price, we call it a measure of “downside leadership.” Why is this useful? Because it assesses the breadth of the market—or lack thereof—which helps us know if the market is losing strength internally.
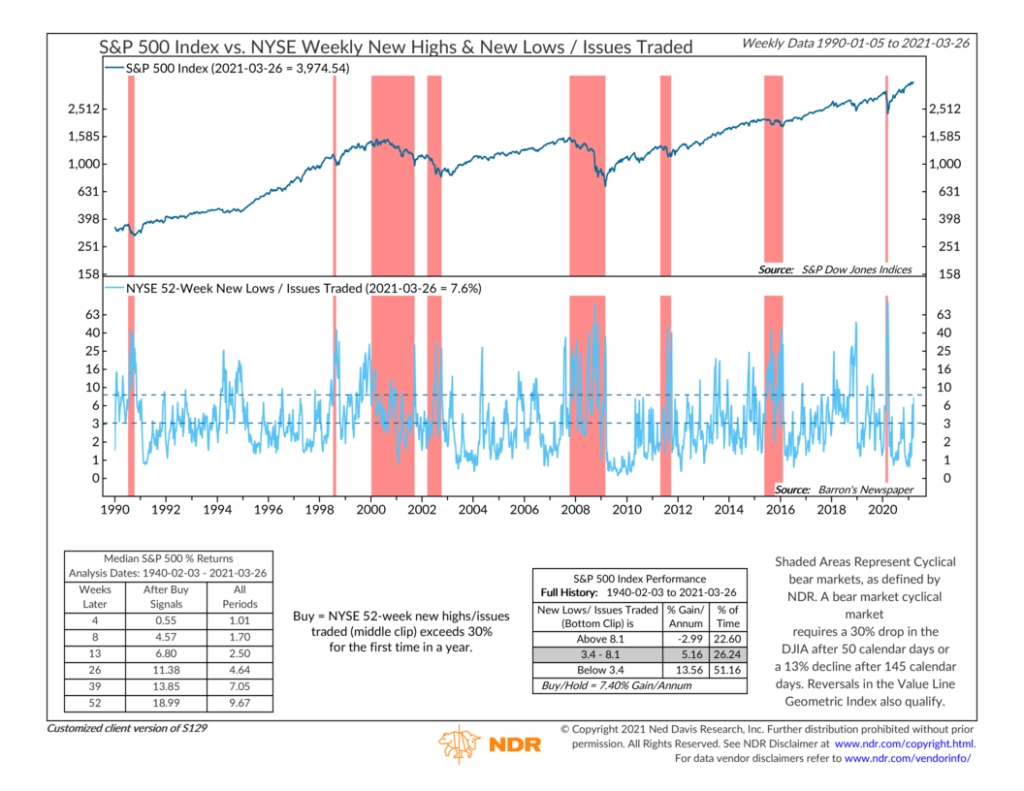
The top part of the chart above shows the S&P 500 index, which we use as a benchmark for the overall stock market’s performance. The bottom portion of the chart shows the number of NYSE stocks falling to new 52-week lows as a percentage of total issues traded. The performance boxes reveal that when the percentage of stocks hitting new lows rises to more than about 8%, it has historically led to negative average annual returns for the S&P 500. But when the percentage of new lows is below roughly 3.5%, the S&P 500 has registered double-digit annual gains, on average.
This makes sense. Almost by definition, we would expect to see a lot of downside leadership (plenty of stocks hitting new lows) in a bear market. Conversely, we see very few stocks hitting new lows during a bull market; in fact, we see the opposite: numerous stocks hitting new highs.
The track record for this indicator going back to 1942 is pretty good. Looking at more recent history, we see that the new lows measure started increasing and sometimes got as high as 30% or more in either the run-up to or during the various market corrections and bear markets we’ve experienced over the past 30 years or so. This feature makes it a reliable tool if your goal is to manage and control risk in your investment portfolio.
This is intended for informational purposes only and should not be used as the primary basis for an investment decision. Consult an advisor for your personal situation.
Indices mentioned are unmanaged, do not incur fees, and cannot be invested into directly.
Past performance does not guarantee future results.