This week’s featured indicator focuses on industrial production, or how much physical stuff is produced in the economy. It includes everything from prescription medicines, cell phones, and TVs to nuggets of gold, steel bars, and planks of wood. Despite our services-dominated economy, we still produce a lot of stuff. We still build things, and we consume tangible goods every day. In fact, industrial production accounts for more than a tenth of the United States’ economic output, so it is an essential and vital part of the overall economy.
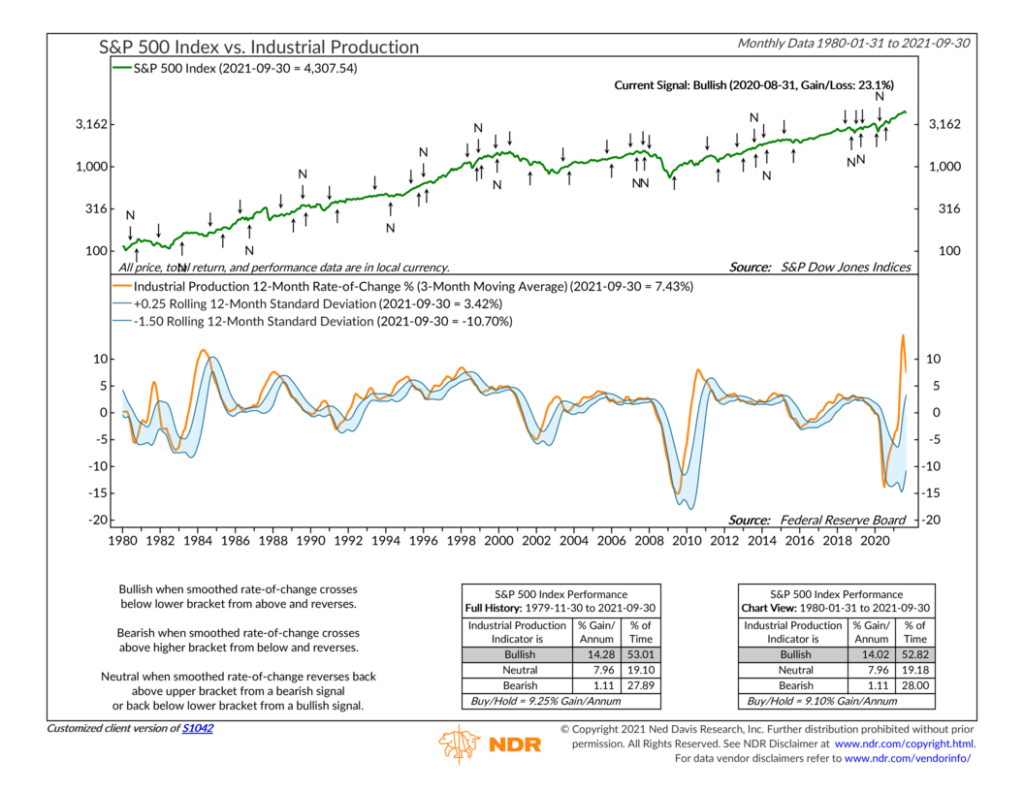
The indicator shown in the chart above is based on the idea that an increasing industrial production growth rate is bullish for the economy and the stock market. In the top clip, we have the S&P 500 stock price index, and in the bottom clip, we have the 12-month change in industrial production (smoothed by 3-months) surrounded by standard deviations bands.
Why the bands? Because we’ve found that when industrial production reaches excessive levels (above the upper band), it can lead to economic strain, meaning the economy soaks up most of the available liquidity (money), leaving less for financial markets. However, in the opposite case, when industrial production falls below the lower band, it means enough time has elapsed to correct whatever excessive production may have previously occurred. The manufacturing economy exerts very little demand on the available liquidity in the overall economy, leaving more room for stocks.
Therefore, a rise above the upper band and then a reversal below it triggers a negative signal for stocks, resulting in weak stock market returns historically. But a fall below the lower band and then a reversal above it triggers a positive signal for stocks. Historically, stock returns have been well above average when this has been the case.
Overall, we think this is a great indicator for assessing the strength of the U.S. economy—which, in turn, has a significant effect on long-run stock returns. When combined with other economic indicators, it creates a well-balanced overview of the overall state of the economy, helping us in our mission of properly measuring and responding to stock market risk.
This is intended for informational purposes only and should not be used as the primary basis for an investment decision. Consult an advisor for your personal situation.
Indices mentioned are unmanaged, do not incur fees, and cannot be invested into directly.
Past performance does not guarantee future results.
880 13th Avenue North
Clinton, Iowa 52732
563-242-9042
5465 Utica Ridge Road
Davenport, Iowa 52807
563-823-0532
9079 East Tamarack Drive
Dubuque, Iowa 52003
800-248-9042
info@nelsoncorp.com
Fax: 563-242-9062
Securities offered through Registered Representatives of Cambridge Investment Research, Inc., a broker-dealer, member FINRA/SIPC. Advisory services through Cambridge Investment Research Advisors, Inc., a Registered Investment Advisor. Cambridge and NelsonCorp Wealth Management are not affiliated. This communication is strictly intended for individuals residing in the states of AR, AZ, CA, CO, CT, FL, GA, HI, IA, ID, IL, IN, LA, MA, ME, MI, MN, MO, MT, NC, NE, NJ, NM, NV, NY, OH, OR, SD, TN, TX, UT, VA, WA, and WI. No offers may be made or accepted from any resident outside the specific states referenced.
Cambridge’s Form CRS (Customer Relationship Summary)
The information being provided is strictly as a courtesy. When you link to any of these websites provided herein, NelsonCorp Wealth Management makes no representation as to the completeness or accuracy of information provided at these sites. Nor is the company liable for any direct or indirect technical or system issues or any consequences arising out of your access to or your use of third-party technologies, sites, information, and programs made available through this site.
