For this week’s indicator, I want to delve a little deeper into this idea of the money supply and how it affects the stock market.
In general, we know that more liquidity is good for the stock market. However, the money supply—a component of liquidity—also influences things like inflation. And inflation, when it is unexpectedly high, is typically bad for stocks.
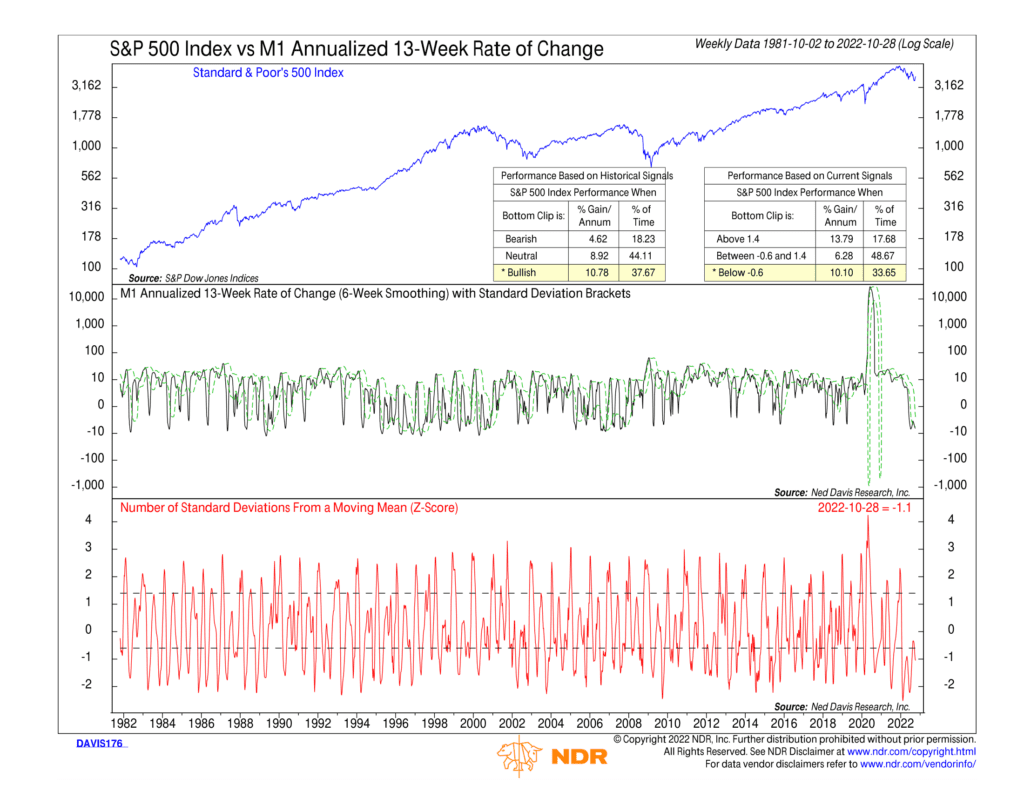
Our indicator above looks at the empirical data and finds that excessive money supply growth is not bullish for stock prices because it tends to lead to inflation.
To measure the money supply, the indicator uses the M1 statistical measure, which consists of things like physical currency (cash), checkable (demand) deposits, and traveler’s checks. In other words, it measures very liquid monies.
The key insight of the indicator is that it uses the 13-week annualized rate of change (smoothed by six weeks) of M1 to determine how fast the money supply is accelerating or decelerating. The black line in the middle clip shows this rate of change measure, and the green dashed lines are standard deviation brackets, designating upper and lower extremes.
We focus on the red line at the bottom of the chart to see how far away the rate of change measure is from these upper and lower extremes. This plot shows the number of standard deviations M1 growth is away from the average. In other words, it’s just a different way of looking at the middle clip.
Historically, when the red line climbs above the upper dashed line, it’s been a sign of excessive growth in the money supply. The S&P 500 Index, shown as the blue line on the top clip, tends to struggle when this is the case. However, when the money supply growth falls to the lower extreme, it puts less pressure on inflation. And this sort of environment tends to be favorable for stock returns, as the performance box shows.
An interesting thing to note about this indicator is its volatility over the past couple of years. For most of the history going back to 1981, the M1 annualized 13-week rate of change was stable, fluctuating around a narrow band. But then 2020 happened, and we saw a massive surge in the money supply growth rate as the monetary authorities stimulated the economy.
But now it has reversed course, and we are seeing some of the slowest money supply growth on record as the Fed tightens monetary policy to fight inflation. In fact, the 13-week annualized growth rate in the money supply is now negative, meaning the money supply is contracting—currently, it’s more than one standard deviation below its average.
Based on the historical record, this could be a favorable environment for stock returns going forward. Theoretically, the big drop in the money supply’s growth rate should eventually start constraining inflation, and when that happens, stocks should start to do better.
This is intended for informational purposes only and should not be used as the primary basis for an investment decision. Consult an advisor for your personal situation.
Indices mentioned are unmanaged, do not incur fees, and cannot be invested into directly.
Past performance does not guarantee future results.