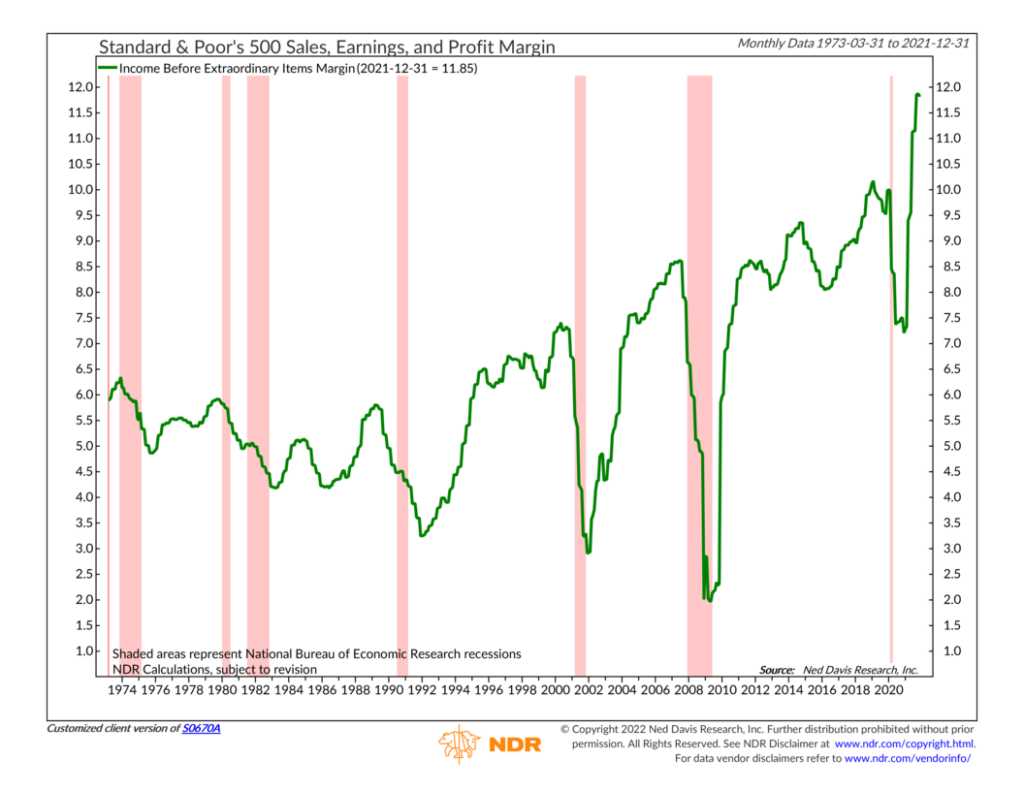
The primary goal of any business is to make a profit; or, at the very least, profits validate a business’s commercial endeavors. So, for this week’s chart, we show the profit margin of S&P 500 companies over the past 50 years.
As you can see on the far right of the chart, profit margins skyrocketed in 2021. Currently, they are hovering around 11.85%, well above the highest point reached before the pandemic, which was just over 10% in early 2019.
Profit margins are a critical component of corporate profitability since they measure how much money a company gets to keep after paying the costs of running the business. You’ll generally see it stated as a percentage. For example, if a company brings in $100 in revenues but has $90 in expenses, its profit or net income is $10. As a percentage of revenues, that’s 10%, the profit margin.
That is why record-high profit margins for S&P 500 companies were so important in 2021. Companies were faced with higher costs—from both materials and labor—but could pass those costs on to consumers via higher prices. In fact, according to JP Morgan, nearly 80% of the earnings per share growth for S&P 500 companies in 2021 came from increased profit margins!
But the question is, will they last? Estimates vary, but labor costs generally account for about 40% of the total costs for corporate America. Economists tend to think wages are “sticky,” and we could see further wage pressure in the coming years. So it all comes down to whether companies can continue to raise prices, which could be problematic after a year of such high inflation.
This is intended for informational purposes only and should not be used as the primary basis for an investment decision. Consult an advisor for your personal situation.
Indices mentioned are unmanaged, do not incur fees, and cannot be invested into directly.
Past performance does not guarantee future results.