Corporate profits matter for the stock market. In fact, corporate profitability is one of the key long-term drivers of stock market performance. So, as investors, it’s important that we accurately measure corporate profits.
A commonly used measure of corporate profitability is Return on Equity (ROE). A company’s ROE is found by taking its annual net income and dividing it by its outstanding equity book value. In other words, it measures how much a company is earning for each dollar of equity invested in the business. Naturally, a higher ROE is preferable to a lower one.
But there’s a problem. A company could be earning higher nominal profits simply because inflation is rising. As investors, we are only concerned with the “real” profits companies can generate, meaning earnings over and above the rate of inflation. So, to correct this issue, we compare corporate profitability to something like bond yields, which incorporate inflation expectations into the interest rate.
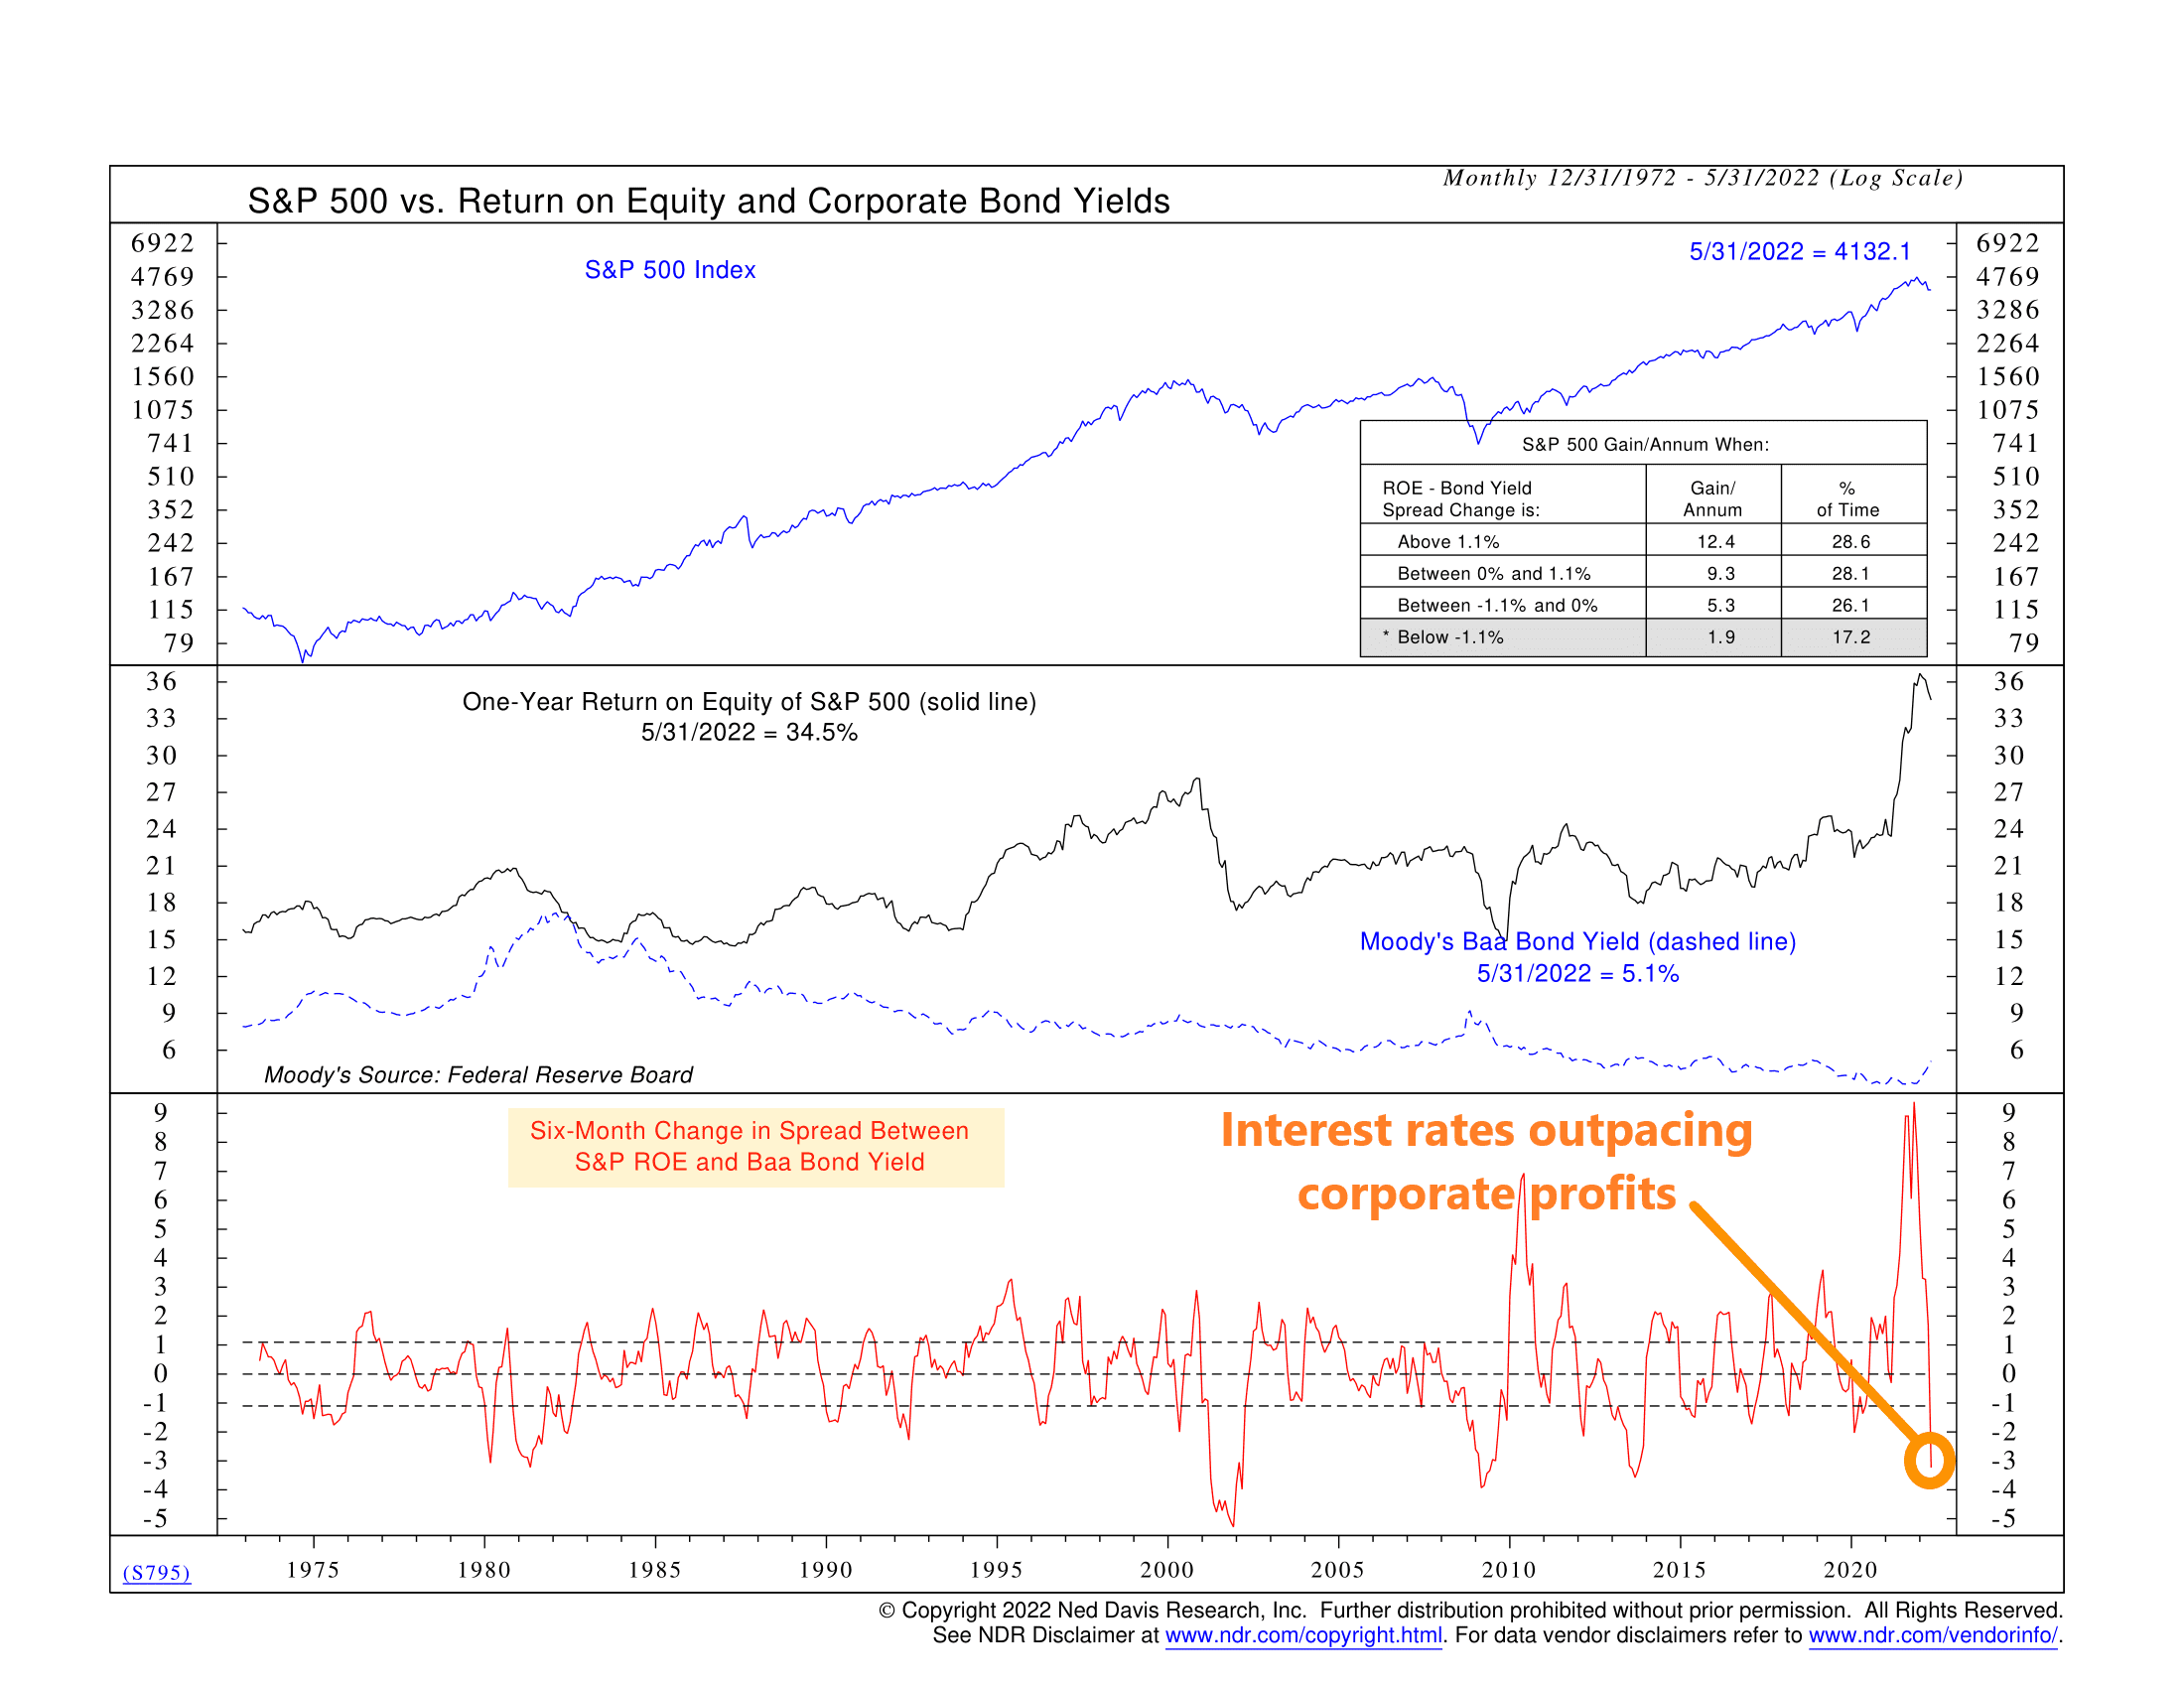
Here’s how we do that. Our chart above shows the one-year Return on Equity (ROE) of the S&P 500 stock index as the black line in the middle clip. We also show the Moody’s Baa Bond yield as the blue dashed line in that same clip. This reflects the return available on corporate debt of comparable risk to the equity used in the ROE calculation. To get our indicator, we take the ROE and subtract the bond yield to get a spread between the two, and then we take the 6-month change of that spread. This is the red line on the bottom clip of the chart.
Why do we take the 6-month change in the spread? Because while the absolute spread is important, we’ve found that the change in the spread is more valuable from a timing/risk adjustment standpoint. And in a nutshell, looking at how wide (high or low) this measure is allows us to see if the ROE on stocks is high or low relative to interest rates and, by extension, inflation.
As the performance box in the top clip of the chart shows, the S&P 500 index performs the best when the ROE-bond yield spread is rising at a 6-month rate faster than about 1.1%. This makes sense because it means that corporate profitability is improving relative to interest rates. However, when the change in the spread gets negative (below -1.1%, to be precise), stock returns are much lower. This happens because as the ROE gets close to or lower than bond yields, stocks start to look riskier compared to bonds, so investors tend to sell equity and buy debt.
So, where does the indicator stand today? As you can see on the far-right hand side of the bottom clip, the ROE-bond yield spread has plummeted to deeply negative territory after being at record high levels the past couple of years. This is mainly due to the sharp rise in bond yields this year. The Moody’s Baa Bond yield has surged from about 3.5% in January to over 5% today. This has occurred while corporate profitability (ROE) has remained high by historical standards (roughly 35% currently).
The takeaway, then, is a common theme we’re all too familiar with this year. Inflation has gotten a lot higher than most expected, and bond yields have surged in response. The swell in bond yields has made stocks look less attractive, despite record-high corporate profitability, as measured by Return on Equity (ROE). With the ROE-bond yield spread falling at such a fast rate over the past six months, the implication, by historical standards, is that this is an environment that is not all that friendly for the stock market.
This is intended for informational purposes only and should not be used as the primary basis for an investment decision. Consult an advisor for your personal situation.
Indices mentioned are unmanaged, do not incur fees, and cannot be invested into directly.
Past performance does not guarantee future results.
