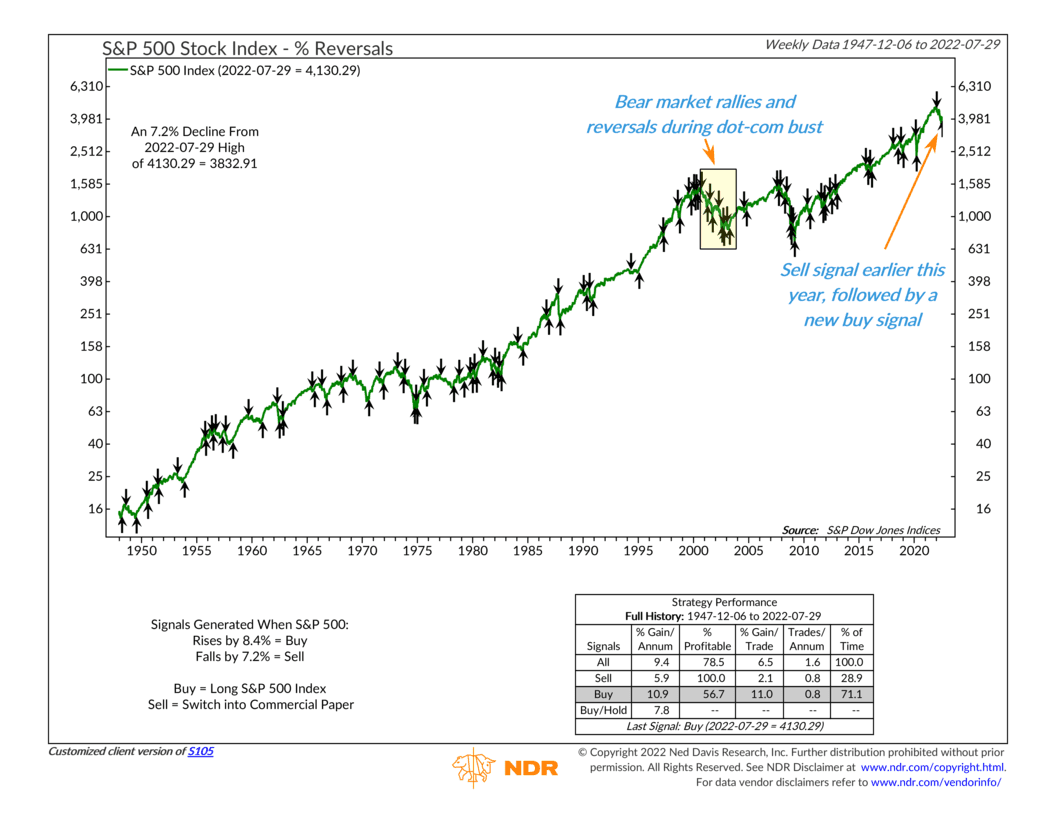
This week, I want to feature an indicator we’ve recently discussed on the blog. It’s a price-based indicator that measures reversals in the stock market. Specifically, it generates buy and sell signals for the S&P 500 index based on percentage reversals from a recent high or a low.
For example, when the S&P 500 index rises 8.4% or more from a low on a weekly closing basis, the indicator produces a buy signal; when it falls 7.2% or more from a high, it triggers a sell signal. It’s that simple. The arrows on the chart denote when these buy and sell signals were triggered in the past.
Looking at the performance box, we see that the stock market’s average annual return after a buy signal has been nearly double the return after a sell signal. Returns after buy signals have been nearly 11%, while returns after a sell signal are around 6%.
Why is this the case? Because the stock market moves with momentum. In other words, once the market starts trending in one direction or another, it tends to continue in that direction for some time. This is a phenomenon that can be exploited in a proper risk management system, as evidenced by the success of this indicator, with data going back more than 70 years.
Looking at recent history, the indicator gave a sell signal in January this year, at the start of what would become a bear market (20%+ drawdown) for the S&P 500 index. That proved to be a good call.
But now, it appears the market is trying to turn a corner. The indicator produced a buy signal last week. This could be a sign that a new bull market is forming. History suggests that’s possible.
But history also suggests that this could be a bear market rally or a short-lived rally within the context of a more prolonged downward trending market. We saw a handful of these rallies during the dot-com bust in the early 2000s. In these instances, a buy signal would be generated from a short-term bounce, but it didn’t last, and the market reversed course and eventually hit new lows, producing more sell signals along the way.
This indicator doesn’t have a way of distinguishing between these two types of rallies. It only uses price as a input. But when we combine it with many other indicators that use different types of inputs, we can get a better look at the bigger picture.
For example, right now, the weight of the evidence suggests that it’s still too early to claim that a stock market bottom is in with a high degree of certainty. Overall, the market’s price action is still pretty weak, and the economic backdrop is terrible.
Our reversal indicator suggests that there might be some light at the end of the tunnel soon. Think of it as an early warning sign that a reversal could be in play. But we will need to see more improvement in our other indicators before we can be sure that this is indeed the start of a new bull market and not just a temporary rally within a broader downturn.
This is intended for informational purposes only and should not be used as the primary basis for an investment decision. Consult an advisor for your personal situation.
Indices mentioned are unmanaged, do not incur fees, and cannot be invested into directly.
Past performance does not guarantee future results.
