One of the primary ways the Federal Reserve influences the economy is through interest rates. By setting the overnight funding rate that banks use to borrow and lend to each other, the Fed can influence other interest rates in the economy. However, there is typically a lag between when policy changes are implemented and when the broader economy feels the effects.
That’s why this week’s indicator focuses on 2-year Treasury yields, which are considered the most sensitive to Federal Reserve policy as their lag time is the smallest. When the 2-year Treasury yield increases by a significant amount, it’s a sign that the Fed is tightening policy. This generally means liquidity is draining from the system, which tends to be bearish for the stock market. And in the opposite case, when the 2-year Treasury yield is falling, it can mean the Fed is easing monetary policy, a bullish condition for stocks.
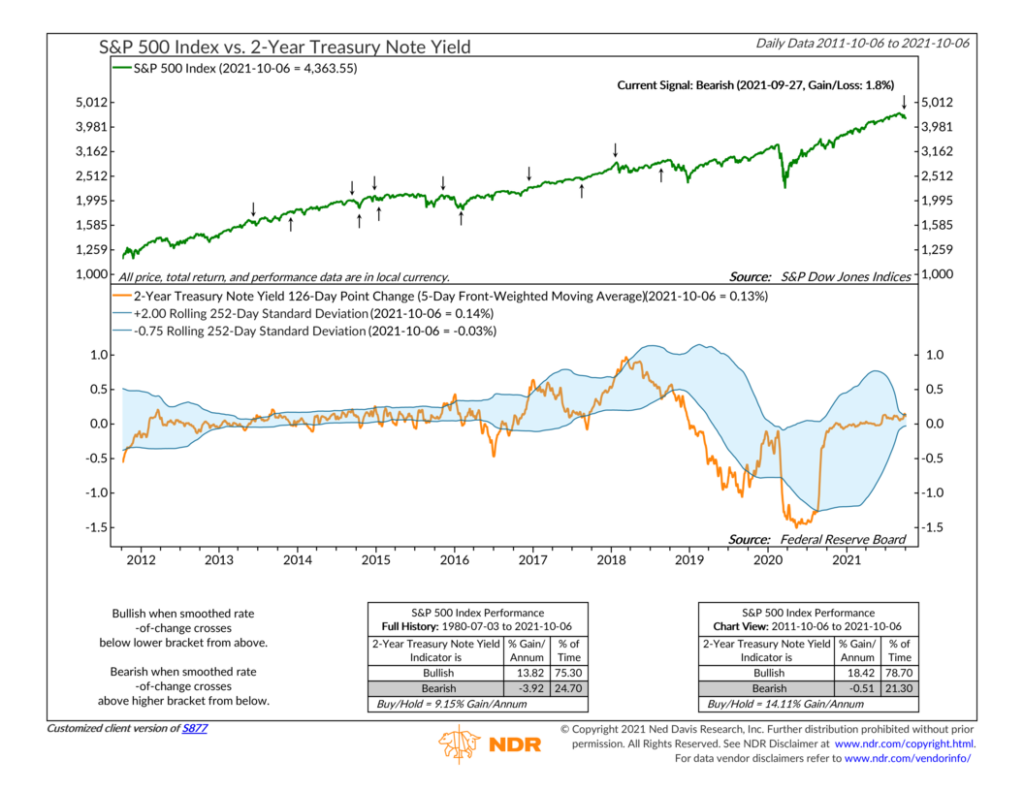
Here’s how it works. We calculate the six-month point change in the 2-year Treasury yield and plot it as the orange line in the bottom section of the chart. We also plot standard deviation bands around this series based on the average point change over the past year. When the six-month change falls below the lower standard deviation band, the indicator turns bullish. But if it rises above the upper standard deviation band, the indicator becomes bearish.
In the top section of the chart, we have the performance of the S&P 500 stock index with the corresponding indicator signals. The performance boxes show that the indicator has been good historically. Over the past decade, the positive signals have resulted in an average annualized gain of roughly 18% for the S&P 500, whereas negative signals have come with an average annualized loss of 0.5%. Over the past 40 years, the signal returns have been similar.
In our modeling process, we consider economic activity to be one of the three major risk categories that influence stock prices. Interest rates are one of the sub-components of this category, and the Federal Reserve is a big player in the interest rate world, which means this indicator is a valuable tool to have when modeling risk and stock market returns.
This is intended for informational purposes only and should not be used as the primary basis for an investment decision. Consult an advisor for your personal situation.
Indices mentioned are unmanaged, do not incur fees, and cannot be invested into directly.
Past performance does not guarantee future results.
