Our good old friend, the VIX Index, is the focus of our featured indicator this week. But what is the VIX Index, you might ask?
It’s a real-time market index that uses option pricing on the S&P 500 Index to determine what market participants think volatility will be over the coming 30 days. In the industry jargon, we call this “implied volatility.” Since people tend to flock to options like puts—the right to sell the S&P 500 stock index at a predetermined price—during times of market stress, the VIX Index is typically thought of as a measure of market risk or fear—hence its moniker, “The Fear Index.”
However, the problem with the VIX is that it can be difficult to use as a stand-alone indicator.
This is because the levels that constitute “high” or “low” volatility have varied over time, and the VIX can remain high or low for considerable periods of time before reversing. To overcome this issue, we apply a deviation-from-trend filter to the VIX.
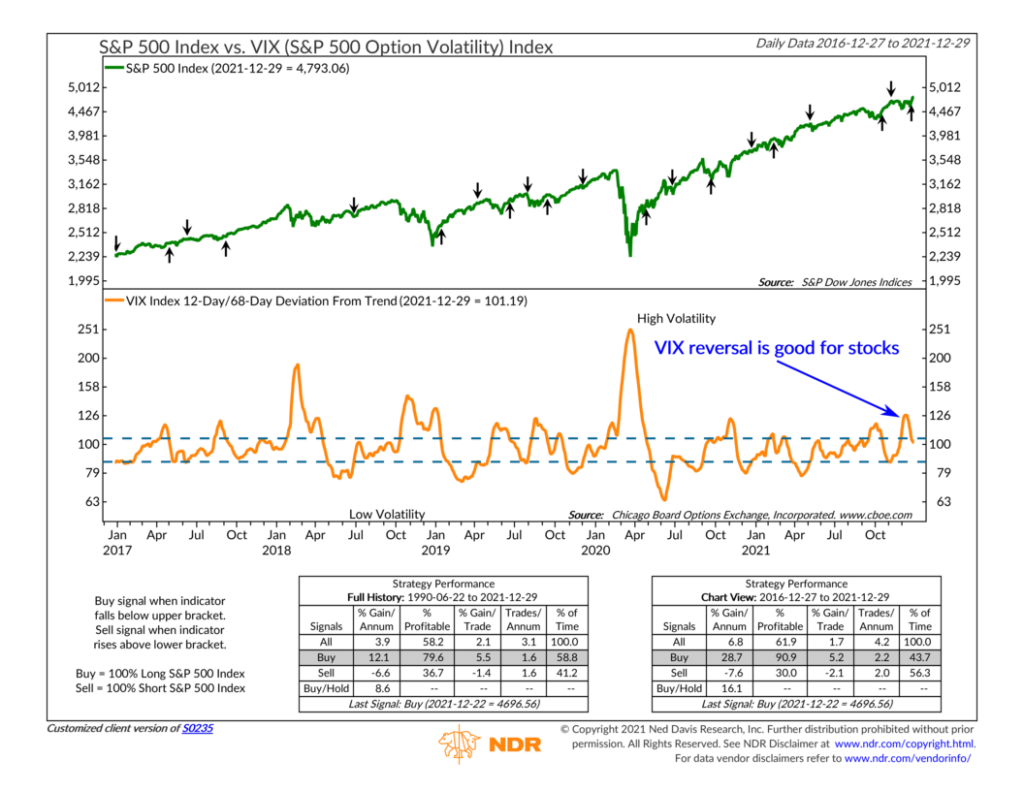
The idea behind the deviation-from-trend technique is that if the VIX is falling hard and fast enough relative to its recent history, it’s a positive environment for stocks. Specifically, the indicator above (orange line) measures the ratio of the VIX’s 12-day average level to its 68-day average level. When the indicator falls below the upper bracket line, it triggers a buy signal for the S&P 500 stock index.
This happened recently, as evidenced by the “buy” arrow on the chart. Fears over the Omicron variant and a hawkish pivot by the Fed led to a surge in the VIX Index that resulted in the ratio peaking around mid-December. At that time, the 12-day average level of the VIX was about 25% higher than its longer-term 68-day average. However, it has come down quite dramatically since then, and the short-term average is roughly back to even with the longer-term average.
This has historically been a positive environment for stocks. As the saying goes, “the harder you fall, the higher you bounce.” This tends to be true for the VIX and the stock market as well. When the VIX comes down hard relative to its recent history—a sign that fear is quickly subsiding—it can set up conditions for a strong rally in stock prices.
Of course, this works in reverse, too. When the deviation-from-trend indicator falls and then rises above the lower bracket, it triggers a sell for the stock market—a sign that complacency had set in, and now suddenly investors are rushing to protect their positions from a market decline.
Looking at the 5-year record of this indicator, you can see how timely these market signals have been. On average, the S&P 500 stock index has returned about 29% annualized after a buy signal and fallen around 8% annualized after a sell signal. Nearly 91% of the buy signals would have resulted in a profitable trade. That’s a pretty strong record that lends credence to the idea that the harder and faster the VIX falls, the better it is for stock prices.
This is intended for informational purposes only and should not be used as the primary basis for an investment decision. Consult an advisor for your personal situation.
Indices mentioned are unmanaged, do not incur fees, and cannot be invested into directly.
Past performance does not guarantee future results.