OVERVIEW
U.S. stocks were mixed last week, with the S&P 500 rising 0.71%, the Dow gaining 0.87%, and the Nasdaq losing 0.09%.
Small-cap stocks lagged the broader market, falling 0.47%. Growth stocks also underperformed, gaining just 0.04%. Value stocks, however, had a good week with a 1.06% gain.
International stocks were also mixed. While developed country stocks gained 1.46%, emerging markets fell 0.9%.
Bonds had a similarly mixed week as the yield on the 10-year Treasury dipped to 1.29%. Shorter-dated Treasuries fell about 0.03%, while longer-dated Treasuries rose by about 0.02%. Corporate bonds were mixed, with investment-grade issues gaining 0.18% but high-yield bonds falling 0.16%. Municipal bonds fell 0.17%, and inflation-protected Treasuries (TIPS) rose 0.26%.
Real estate traded lower by about 0.15%. Commodities, however, rose about 0.51% overall. While oil fell 0.29%, gold rose 0.86%, and corn increased 3.19%. The U.S. dollar fell about 0.28%.
KEY CONSIDERATIONS
A Few Observations – It’s been a quiet year for the U.S. stock market—at least as far as drawdowns go. Sure, we had a few selloffs in the 3%-4% range—but that’s nothing. The stock market keeps pushing ahead. On average, the S&P 500 stock index is reaching a new high every three days or so. It doesn’t get much better than that. And as far as the weight of the evidence, it still suggests the current environment is a good one for stocks.
The primary reason for this is the price movement of the stock market itself. The trend, as we like to say, has certainly been our friend this year. Sure, breadth started deteriorating at the beginning of the summer, which led to a few minor selloffs, but the weakness didn’t last long.
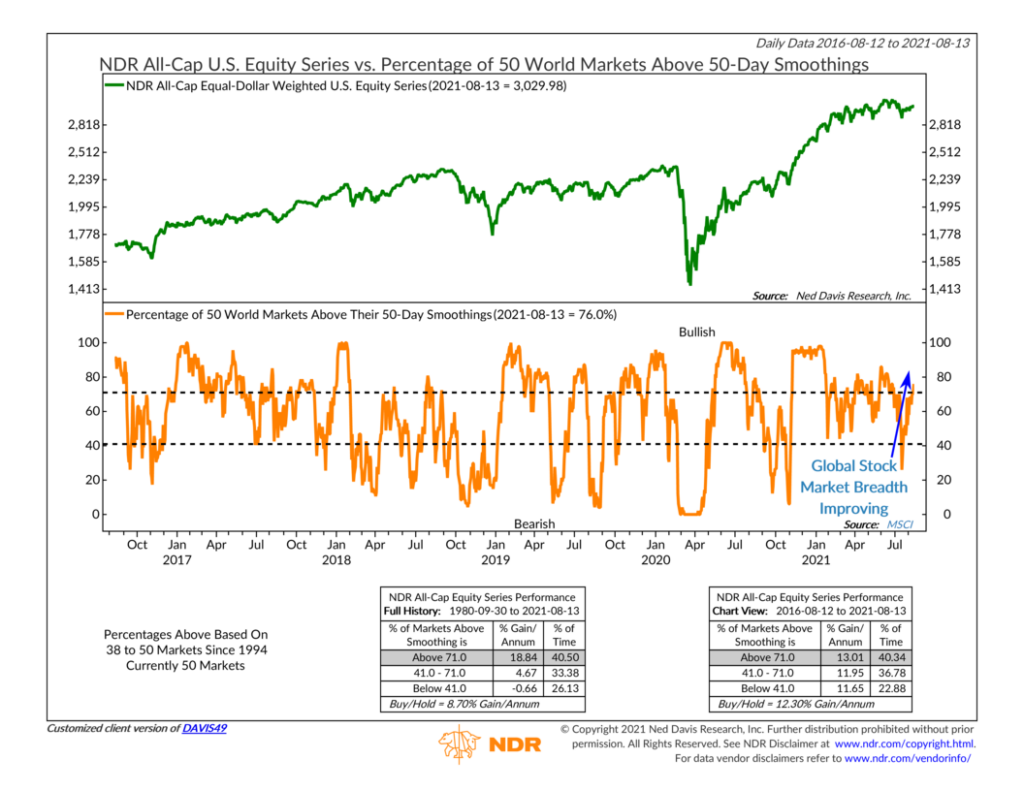
Strengthening global breadth has helped. The chart above shows the percentage of global stock markets trading higher than their average 50-day price. In other words, it’s showing global stock market breadth. It recently rose to 76% from just 26% about a month ago. This is important for U.S. stocks because the U.S. stock market is more global than ever, generating revenue from all corners of the globe. And historically, bullish price trends in global stocks have generally coincided with bullish price trends in U.S. stocks.
But while stock prices have remained resilient all year, what we call investor behavior (sentiment) has been steadily declining. Valuations are sky-high, and optimism is soaring. These are the types of conditions that leave stocks vulnerable to big down moves when the price action breaks down, and stock trends reverse.
Take margin debt, for example. You can see it really take off after the March 2020 selloff. This makes sense. A rising market attracts traders who use margin (loans) to take advantage of the market’s advance. But eventually, the music stops, the party ends, and traders are forced to sell their stocks to meet their margin calls.
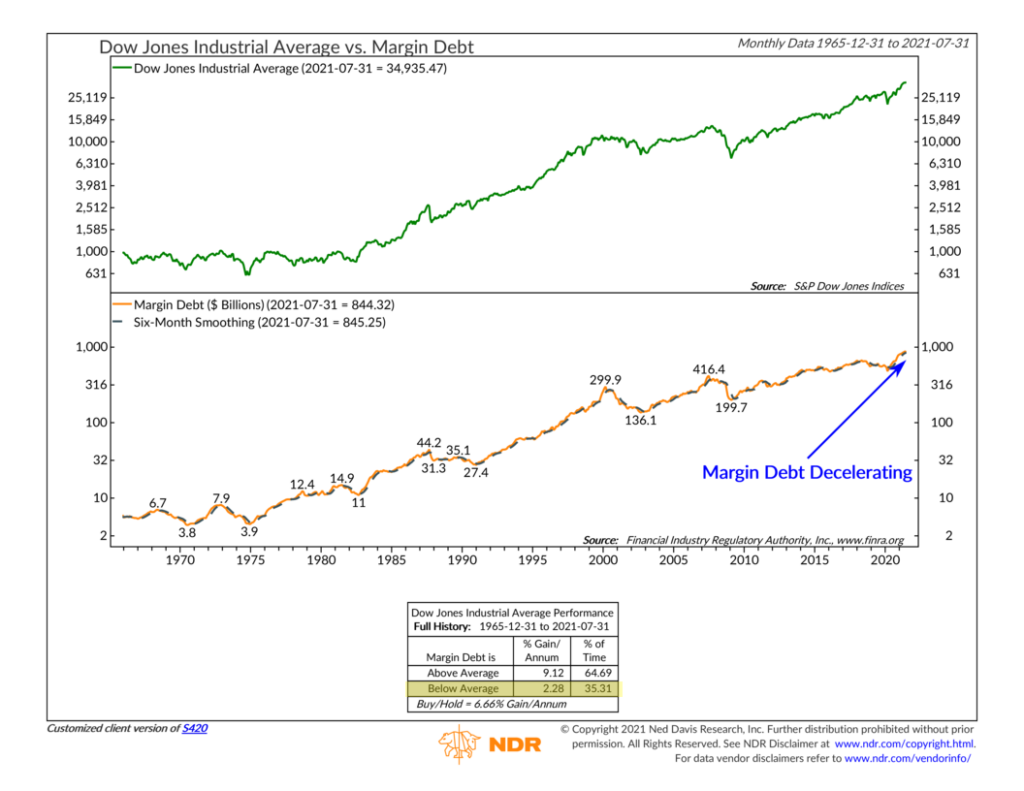
Ok, things don’t always end badly. But the chart above does show that when margin debt begins to fall below its six-month average—as it recently did—it’s a sign of weakness ahead for U.S. stocks. Historically, the Dow Jones Industrial Average has gained just 2.28% per annum, on average, when margin debt has fallen below its six-month average.
Again, that doesn’t mean the stock market is going to crash tomorrow. The weight of the evidence still leans bullish, as I’ve highlighted above. But it does mean that if the strong price movement in stocks goes away, it’s less likely we’ll be able to count on many of the indicators in the investor behavior category to keep the party rolling.
This is intended for informational purposes only and should not be used as the primary basis for an investment decision. Consult an advisor for your personal situation.
Indices mentioned are unmanaged, do not incur fees, and cannot be invested into directly.
Past performance does not guarantee future results.