OVERVIEW
U.S. stocks rose yet again last week, with the S&P 500 rising 1.97 percent.
This gain was roughly on par with the Dow, which rose 1.82 percent.
The Nasdaq, however, outpaced both indices, rising 2.29 percent.
International stocks lagged behind the U.S. but still had a good week. Emerging market stocks gained 1.16 percent, and developed country stocks rose 0.85 percent.
The yield on the 10-Year Treasury note dipped in the middle of the week, but it ultimately ended the week roughly where it started.
Bond gains were mostly muted for the week, with moderate increases in municipal and high yield corporate bonds.
Real estate had a good week, posting a gain of about 2.45 percent.
Commodities, however, fell over one percent as the U.S. dollar strengthen by about a third of a percent.
KEY CONSIDERATIONS
It’s Quiet…a Little too Quiet? – It has been eerily quiet in the stock market lately. As of last Friday’s close, the S&P 500 has gone 67 days without a 1% or more daily move in either direction.
The index has climbed steadily higher during this recent period of low volatility, gaining nearly 12 percent. But some would caution that this gentle ascent has bred complacency among investors –perhaps sowing the seeds for a potential market downturn.
Does this argument have legs? To an extent, maybe.
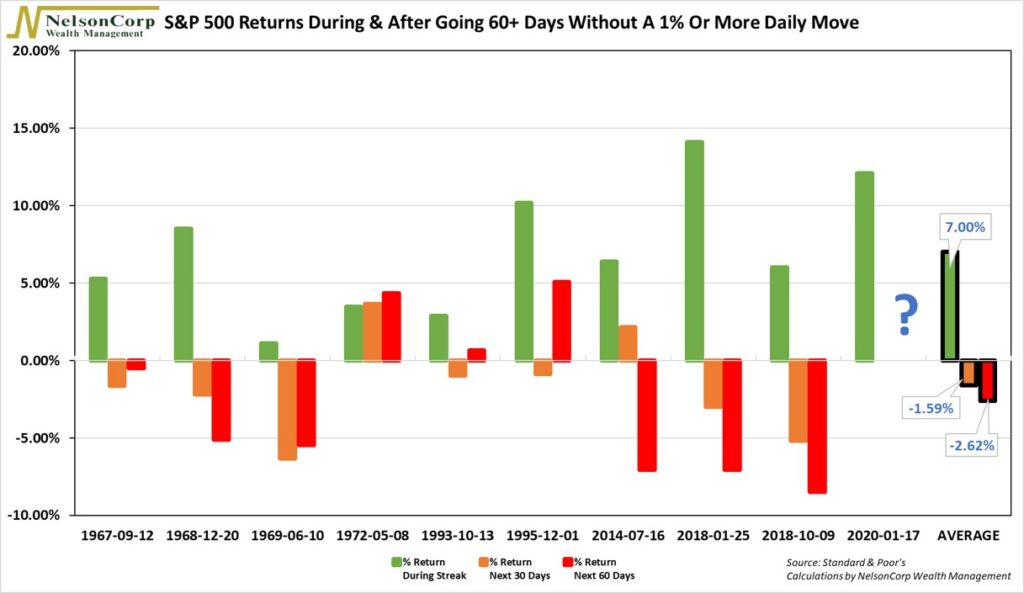
There have been ten instances (including the current streak) where the S&P 500 has gone 60 days or more without a 1% or more daily move since 1967. The average streak was 74 days, and stocks posted an average cumulative return of nearly 7 percent during these periods.
However, over the subsequent 30 trading days after the streaks ended, the average cumulative return was -1.59 percent. Over the next 60 trading days, average returns were about -2.62 percent.
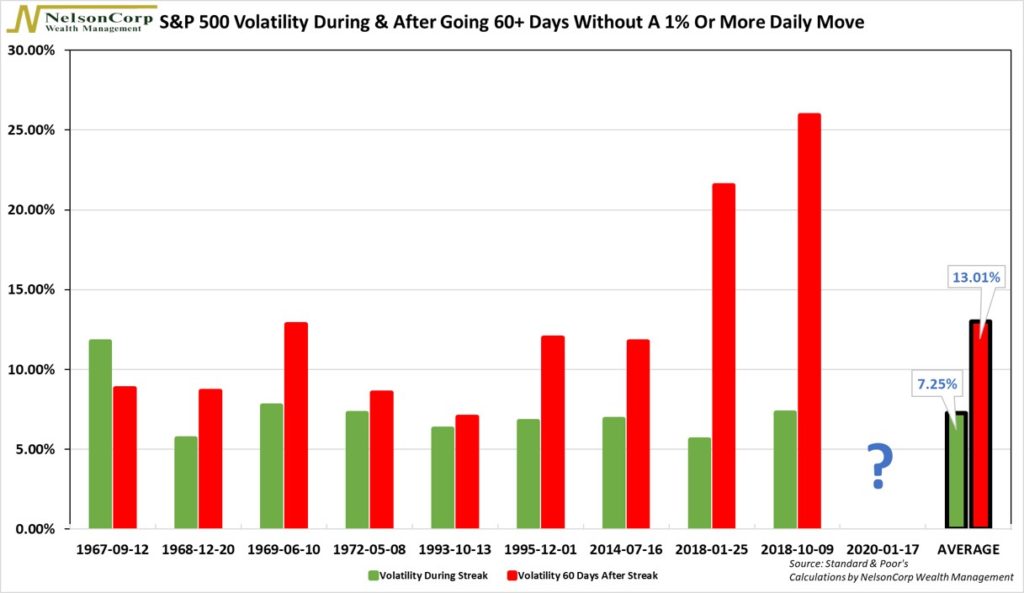
Perhaps more interestingly, though, is that the average annualized volatility, while the streaks were intact, was about 7.25 percent. The next 60 days after the streaks ended, however, volatility increased by nearly 80 percent on an annualized basis, to about 13 percent.
What does this all mean? Well, given such a small sample size, perhaps nothing. And you wouldn’t want to base an investment strategy solely around this type of analysis.
However, there is a major takeaway, and it is related to the work of two influential thinkers: Hyman Minsky and Benoit Mandelbrot.
Hyman Minsky was a professor of economics at Washington University, where he developed his theory of financial instability. In a nutshell, he claimed that “stable economies sow the seeds of their own destruction.”
Why? Because stability induces risk-taking behavior that, in turn, creates financial instability. His theory was vindicated after the financial crisis struck in 2008.
While Minsky’s hypothesis applied mainly to the economy as a whole and not the stock market, it is somewhat related to Benoit Mandelbrot’s idea of “volatility clustering.”
Mandelbrot, a French-speaking math professor, discovered that tame market days (low volatility) are usually followed by other tame days. By contrast, wild days (high volatility) are generally followed by other wild days.
The fascinating part, though, is that these wild days tend to cluster together once they start, and they are typically associated with pronounced downturns in the stock market.
In other words, big moves in either direction are a sign that you could be in or are very near a correction or a bear market.
Going back to our analysis from above, we found that not only were returns lower after the S&P 500 went a long time without a major daily move but that these lower returns were associated with low and rising volatility.
This outcome conforms to the results of other studies that employed different measures for volatility. These studies revealed that, on average, high and falling volatility is good for stock returns, while low and rising volatility is bad.
The Bottom Line – This is all just a long-winded way of saying that nothing lasts forever. Things that aren’t sustainable eventually break down and revert to some former (or new) state.
To be sure, running the analysis above is just a fun way of looking at the market and its past performance.
It adds color to our understanding of the stock market, but it probably isn’t a robust strategy for making investment decisions.
Nonetheless, it does help us understand risk and how it builds over time. And it highlights some of the broader economic theories about how markets composed of people behave.
Focusing on risk allows us to focus on making good decisions, even if those decisions don’t always lead to good outcomes.
It would be foolish to assume that just because you ran a red light and didn’t get into an accident that it was a good decision.
This is intended for informational purposes only and should not be used as the primary basis for an investment decision. Consult an advisor for your personal situation.
Indices mentioned are unmanaged, do not incur fees, and cannot be invested into directly.
Past performance does not guarantee future results.