OVERVIEW
The U.S. stock market bounced last week after three straight weeks of declines. The S&P rose 6.45%, the Dow gained 5.39%, and the Nasdaq surged 7.49%.
As for foreign markets, developed country stocks rose 2.8%, and emerging markets gained 0.65%.
Helping propel stocks was a reversal in interest rates that saw the 10-year U.S. Treasury notes’ yield fall to 3.1%. Long-term Treasury bonds gained around 0.77%. Investment-grade corporate bonds rose 0.34%, and high-yield (junk) bonds increased 0.57%.
Real asset performance was more mixed. While real estate surged over 6% for the week, commodities fell more than 4% broadly. Oil dropped about 2.5%, gold was down 0.56%, and corn plummeted 7.46%. And the U.S. dollar weakened around 0.61%.
KEY CONSIDERATIONS
A Low? – The U.S. stock market had a nice rally last week. The S&P 500 stock index rose nearly 6.5% in just four trading days. This was after two straight weeks of 5%+ declines, which had resulted in the S&P 500 entering bear market territory (defined as 20% or more off its all-time high).
So, what happened?
Well, investors have turned their focus to the prospect that an economic recession is right around the corner for the U.S. economy. If a recession occurs, the decreased demand for goods and services should theoretically put downward pressures on inflation and, in turn, interest rates.
For example, crude oil prices have fallen from a recent high of about $122/bbl on June 8th to roughly $107/bbl. That’s a drop of more than 12% in just a few weeks—a sign that inflation pressures might be easing somewhat.
And as the chart below shows, the benchmark U.S. 10-year Treasury interest rate has fallen from its peak of 3.49% just two weeks ago to 3.09% as of Friday’s close.
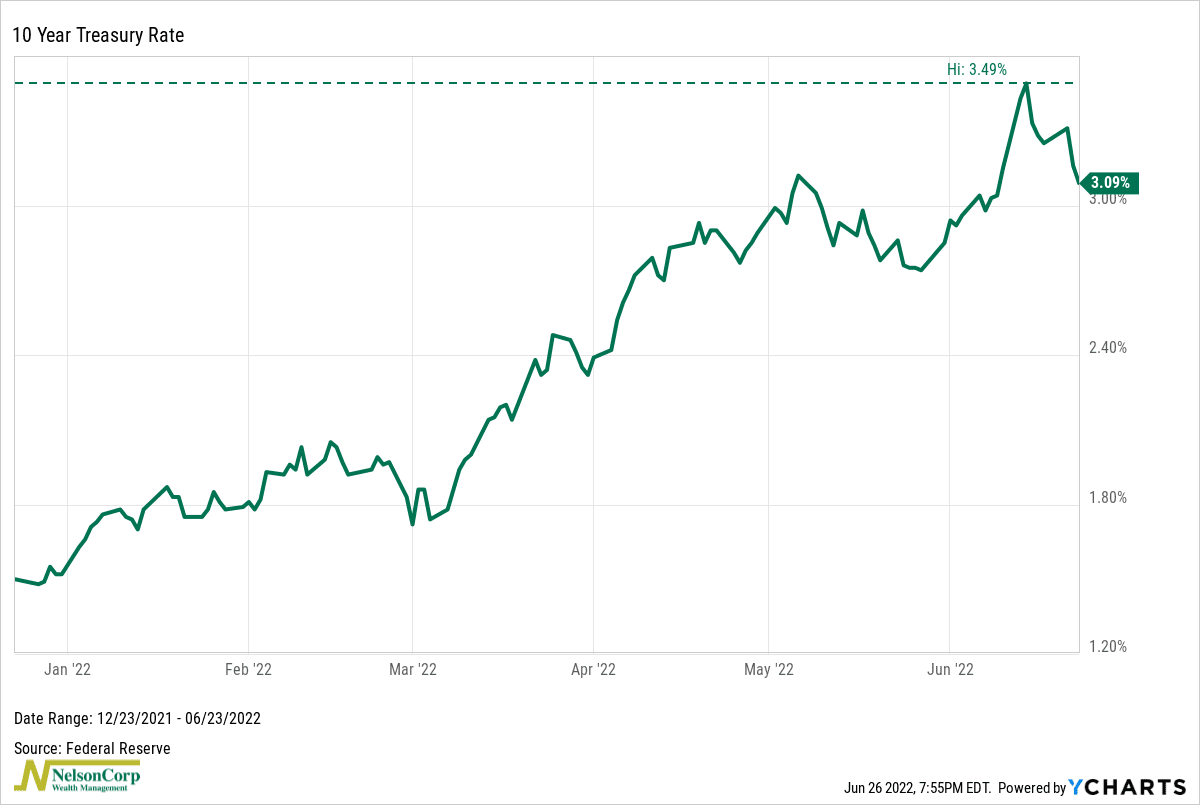
So, since rising inflation and interest rates have been the main reasons stocks have sold off so hard this year, investors figure any sign that either or both are easing is a reason to buy stocks.
At the very least, some indicators do point to the idea that stocks could be looking to stabilize, and perhaps even put in a low.
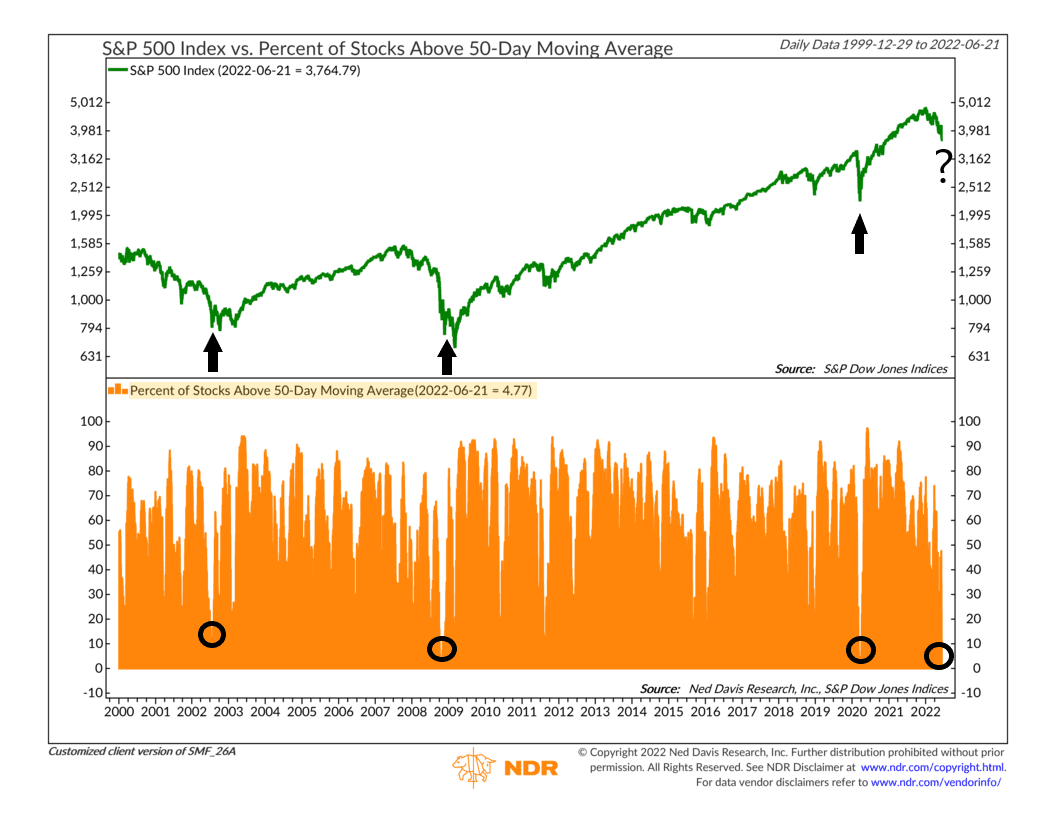
For example, as shown on the chart below, the percentage of stocks in the S&P 500 trading above their 50-day average price has fallen to under 5%. The stock market has only ever gotten this oversold near the bottom of previous major bear markets, such as 2002, 2008, and 2020.
General pessimism is also very high in the marketplace, which is a good sign from a contrarian standpoint. Our Investor Behavior model, shown on the chart below, is nearing bullish levels. This model measures what investors are doing and saying, and when it reaches higher levels, it means investors are generally downbeat on the market.
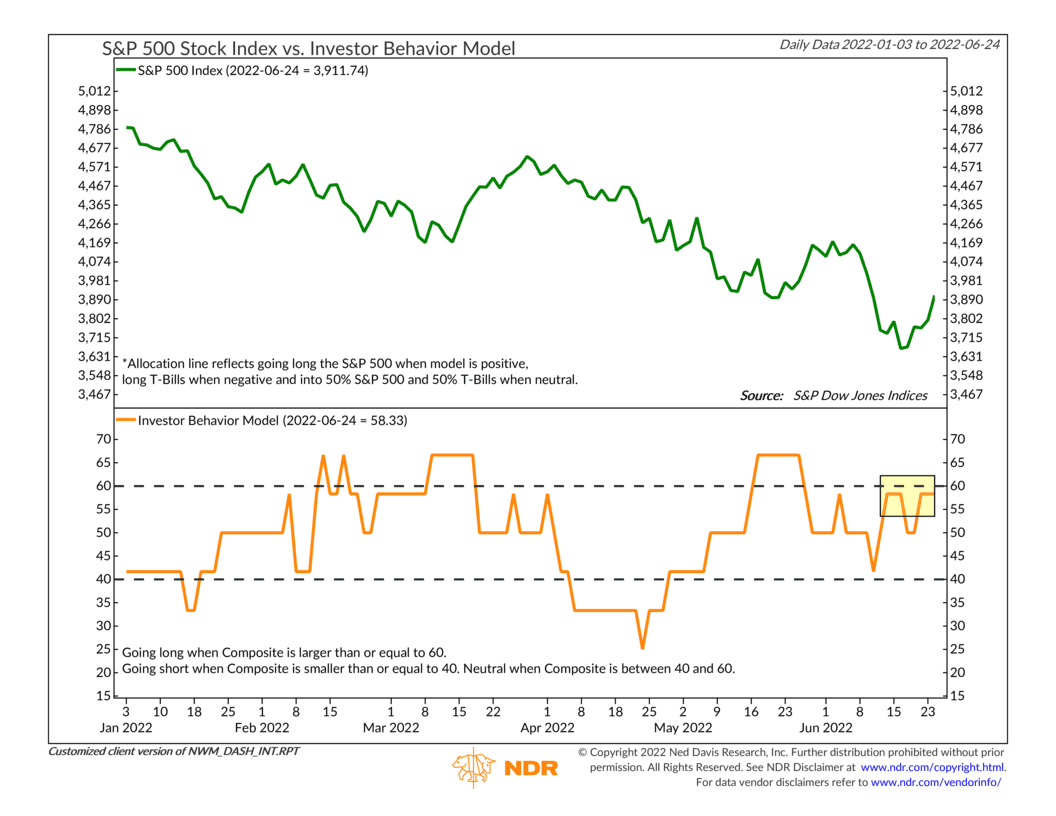
Major lows in stock prices tend to occur when fear is at its peak, so this is an important tool to keep an eye on. The past two market rallies occurred when this model reached bullish levels; however, the model didn’t stay bullish very long, nor did prices. We’ll be looking to see if things change this time around.
So, that’s the good news. It does appear that stocks are looking for some relief after a few weeks of hard selling. Conditions are in place for stocks to make A low here; maybe not THE low—but perhaps A low.
That then begs the question: Is there a case to be made that we haven’t yet seen the low of this cycle?
Short answer: yes.
And I’ll end with one more chart that supports that argument. It’s what we like to call a “thrust” indicator. It’s based on the price movements of stocks themselves. Specifically, it measures the percentage of stock market sub-indices at 26-week new highs minus the percentage of indices at 26-week new lows. This is shown as the red lines on the bottom clip of the chart below.
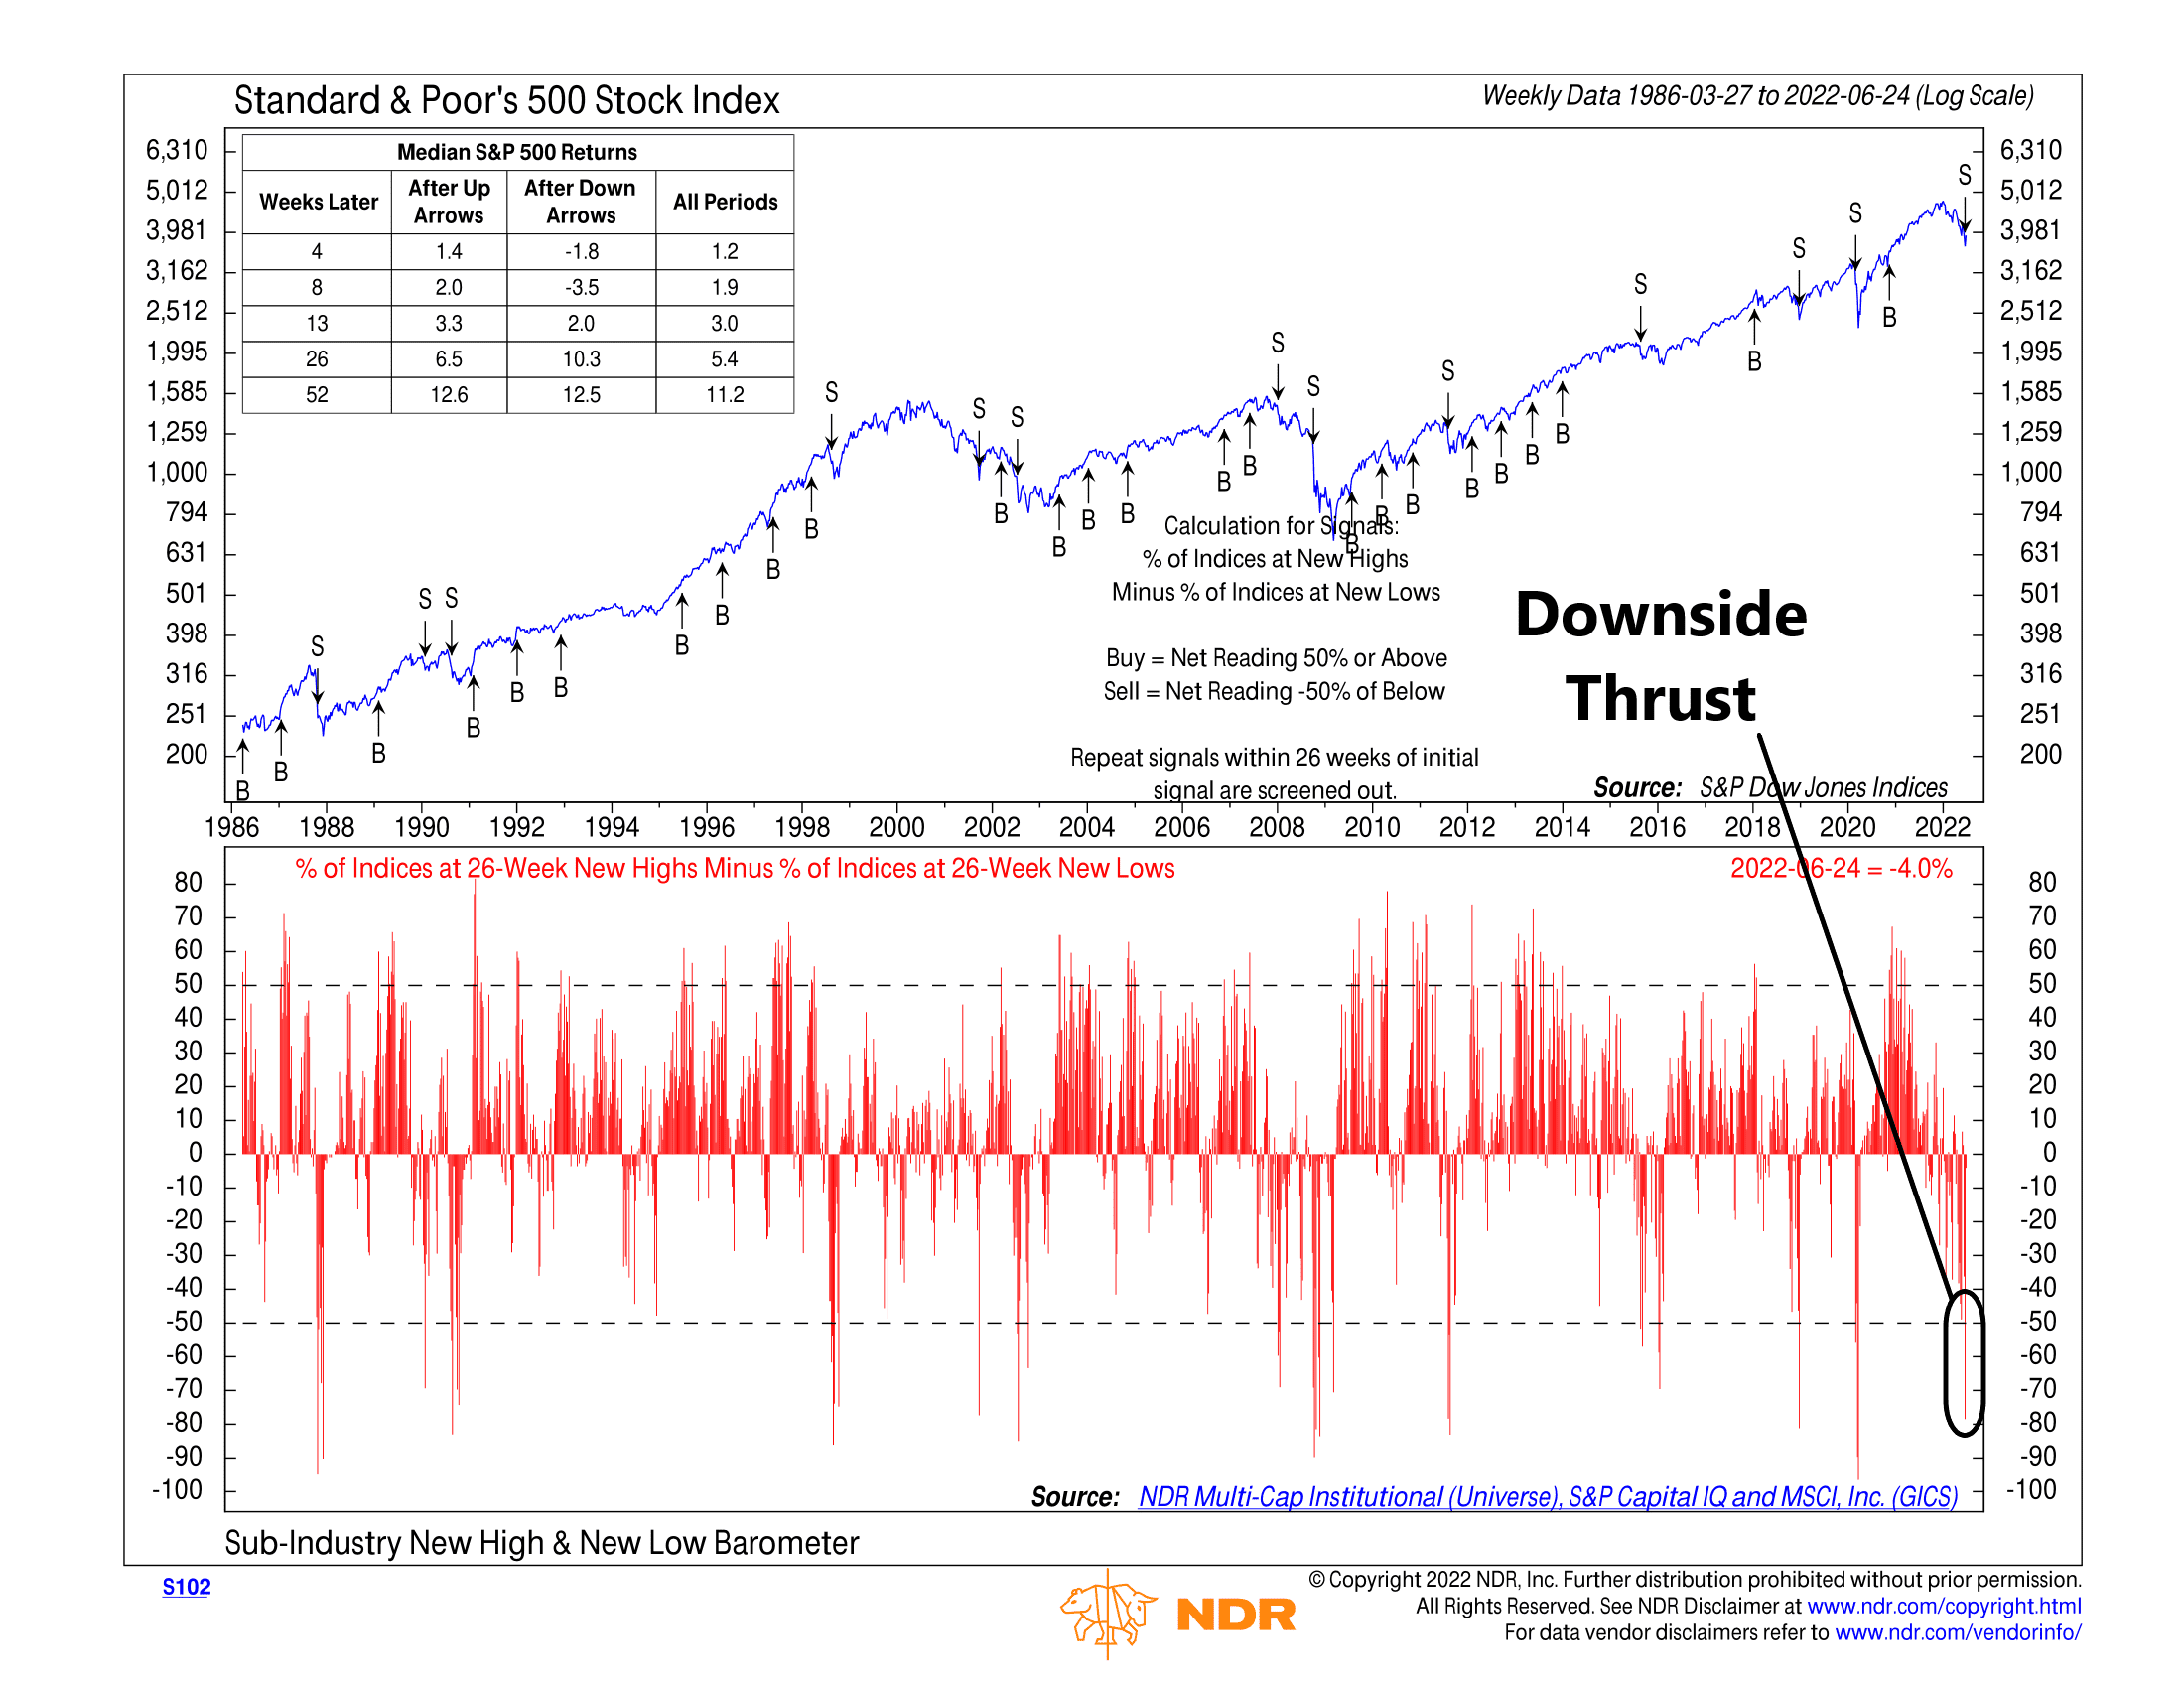
Last week, it reached a net reading of -78.5%, resulting in a sell signal for the S&P 500. A reading below -50% has historically resulted in negative stock market returns 4 to 8 weeks later.
Bottom line: We like to stay in tune with what the stock market is telling us from a price-based standpoint, and downside thrust readings like this one don’t give us much of confidence in the market when they occur.
This is intended for informational purposes only and should not be used as the primary basis for an investment decision. Consult an advisor for your personal situation.
Indices mentioned are unmanaged, do not incur fees, and cannot be invested into directly.
Past performance does not guarantee future results.