OVERVIEW
After a big rally the week before, the U.S. stock market took a step backward last week. The S&P 500 fell 1.2%, the Dow lost 0.94%, and the Nasdaq declined 0.98%.
Implied volatility remains elevated, with the VIX index hovering around the 25 range. At this level, the market is expecting the S&P 500 to move roughly +/- 7% over the next month.
Foreign stock markets were mixed last week. Developed country stocks lost around 0.33% while emerging markets gained 1.68%.
Bond prices were down across the board as the benchmark 10-year Treasury rate rose to 2.94%. Long-term Treasuries lost 2.52%, investment-grade corporates fell 0.85%, and high-yield (junk) bonds declined 0.35%.
Commodities mainly were mixed for the week. Oil surged about 4.7%, while gold dropped 0.38%, and corn fell 6.47%. Real estate declined roughly 2%. And the U.S. dollar gained about 0.5% to end the week.
KEY CONSIDERATIONS
Another Failed Rally – About two months ago, the U.S. stock market—as measured by the S&P 500 index—embarked on a rally that saw it gain roughly 8% in the span of just three weeks.
At the time of that rally, I noted that we needed to see the S&P 500 hit an index level of about 4557 on a weekly closing basis, which would indicate a gain of 8.4% from the previous low.
Why? Because historically, reversals of that magnitude have coincided with stronger market returns going forward.
However, after the third week of the rally, the market ran out of gas. It failed to reach that critical level, and the S&P 500 tumbled 14% from there.
Failed market rallies. They happen.
The interesting thing, however, is that the March low has now become the key rally point for the S&P 500 today. As shown on the chart below, the stock market hit a new low of 3901 on May 20th. An 8.4% gain from there would put it around 4230, roughly where the low was during that March rally.
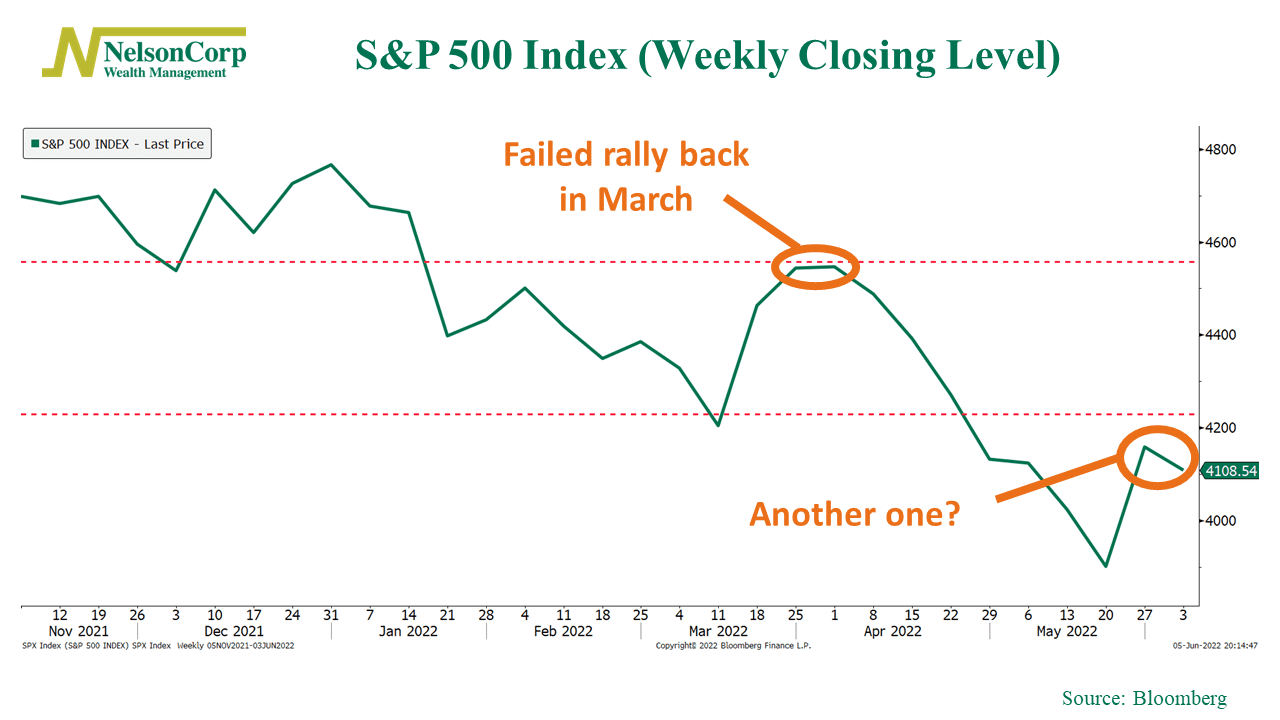
Unlike that March rally, however, it appears the S&P 500 has already taken a pause. The index dropped 1.2% last week. That means we would still need to see it rise roughly 3% in the coming weeks before it would be considered a market reversal, according to this measure.
So why did the market seemingly lose steam? Well, one explanation could be the better-than-expected economic data that was released last week.
The Institute for Supply Management Manufacturing Purchasing Manager’s Index came in stronger than expected for May. As shown on the chart below, the recent reading of 56.1 was a slight uptick from the previous month’s reading of 55.4. Any number above 50 indicates an economic expansion.
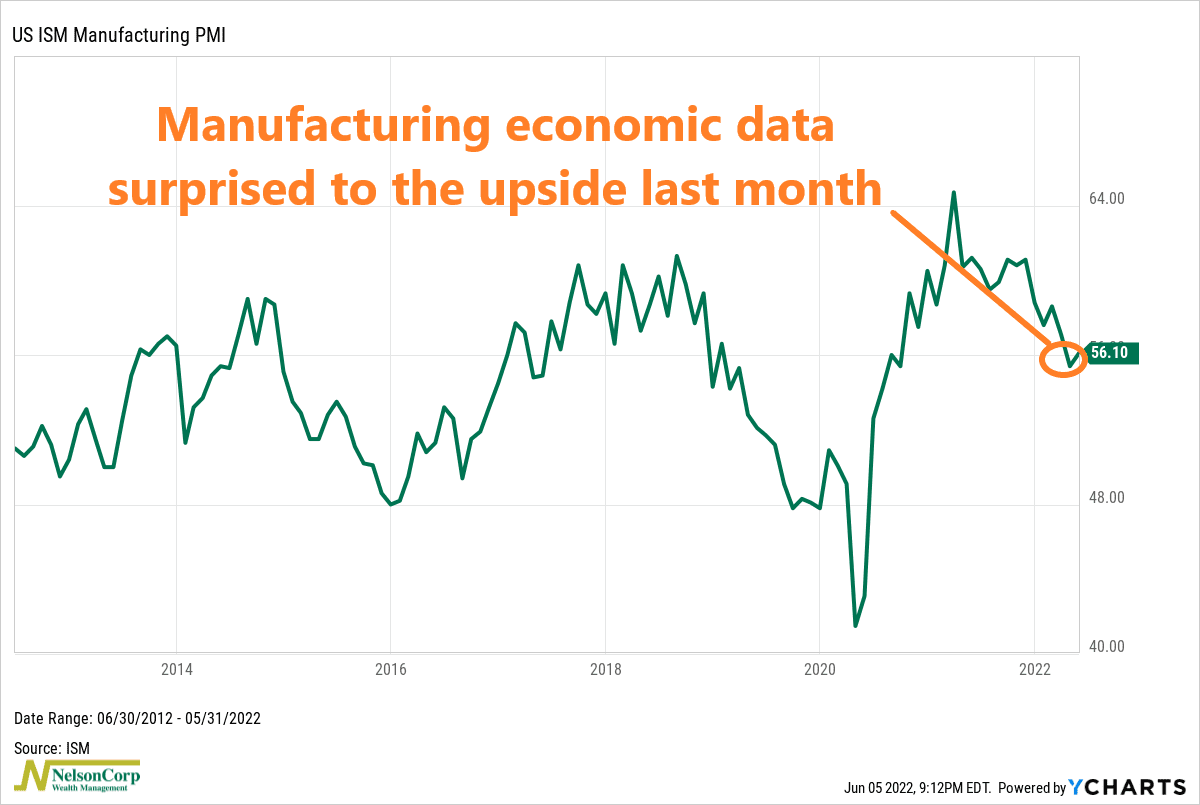
So, the news here looks good for the health of the U.S. economy. But, in the upside-down world of high inflation that we currently live in, good news for the economy is bad news for the stock market.
How so? Because that means the Fed will likely stay steadfast in its intention to raise rates to cut off the head of inflation, even if that means slowing down the economy and/or the stock market.
Indeed, as I show on the chart below, the 3-year U.S. Treasury note rate resumed its upward march last week after it looked like it might be rolling over.
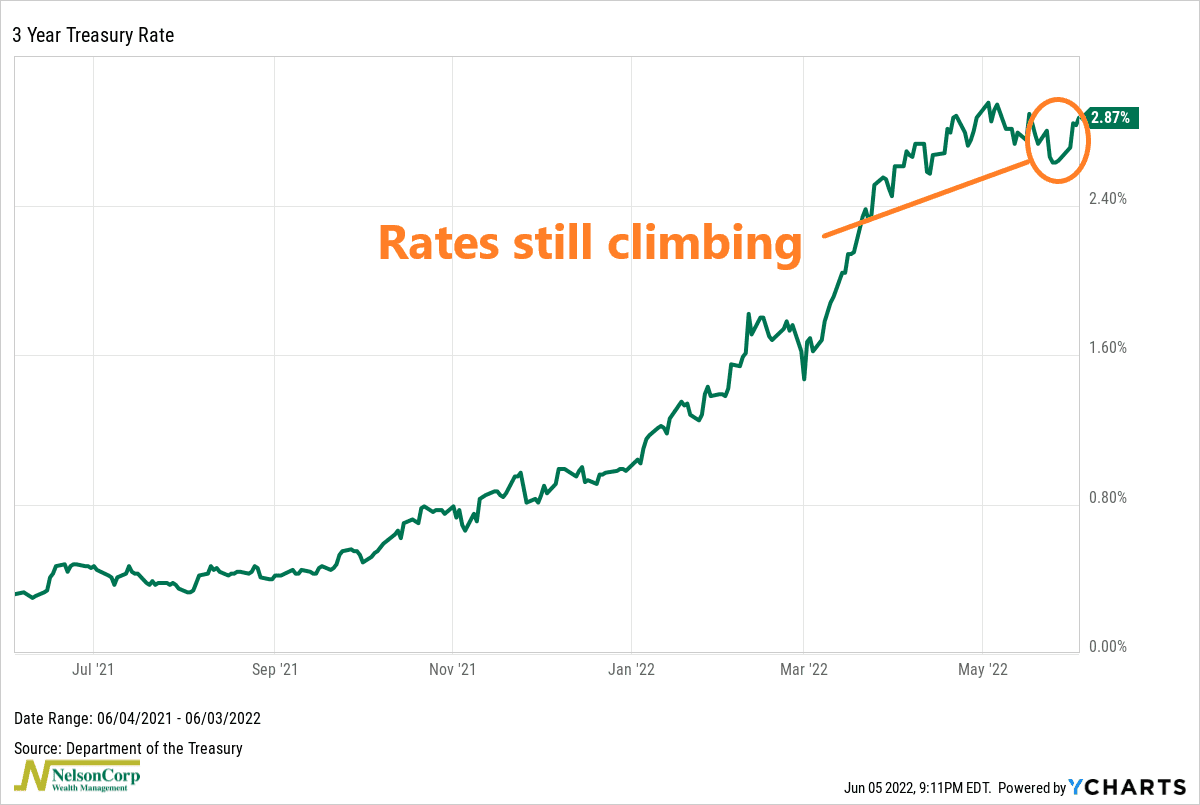
In fact, by the end of May, the 26-week rate-of-change of the 3-year note yield was the highest since August 1994. This bearish monetary environment will likely continue to be a headwind for the stock market.
This is intended for informational purposes only and should not be used as the primary basis for an investment decision. Consult an advisor for your personal situation.
Indices mentioned are unmanaged, do not incur fees, and cannot be invested into directly.
Past performance does not guarantee future results.