OVERVIEW
Volatility jumped last week, with the VIX Index climbing over 33 by the week’s end. The result was the U.S. stock market taking another leg lower, as the S&P 500 dropped 3.27%, the Dow fell 2.47%, and the Nasdaq tumbled 3.93%.
Over in the bond market, returns were more mixed. The yield on the 10-year Treasury note rose to 2.93%. Short- and intermediate-term Treasuries saw moderate gains, while long-term Treasuries were slightly lower. However, investment-grade corporate bonds fell 0.4%, and high-yield (junk) bonds dropped 0.91%. Municipal bonds shed about six basis points, and TIPS traded lower by about 0.3%.
Real estate had a rough week, falling around 5.3%. Commodities, however, gained about 0.35% broadly. Oil rose 1.11%, corn gained 3.11%, and gold dropped 1.17%. And finally, the U.S. dollar had a big week, gaining about 1.92%.
KEY CONSIDERATIONS
Any Winners? – Last week, I talked about the spots in the market that our model has flagged as being the weakest. So naturally, that begs the question: Are they any areas looking particularly strong?
The answer, unfortunately, is not really.
From an economic standpoint, our model sees things as moderate to negative right now. Even financial liquidity, which had been such a powerful tailwind for stocks over the past couple of years, is no longer a positive force.
For example, the real (inflation-adjusted) M2 money supply has essentially stopped growing on an annual rate-of-change basis, shown below.
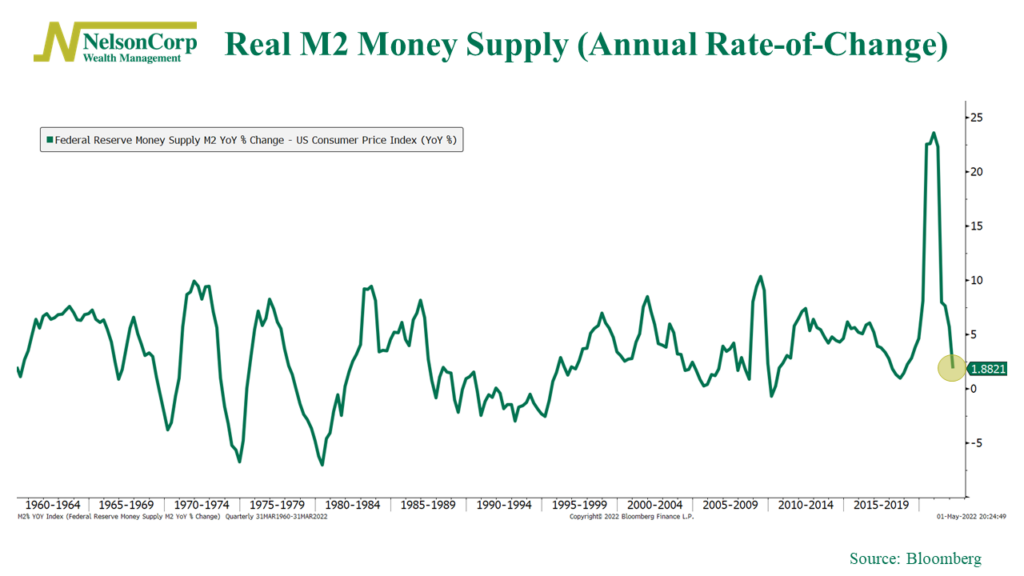
This paints a more challenging road ahead for equities. Plus, unlike past crises, it’s a lot harder to see how the Fed will step in and provide relief this time around if stocks crash further, given how lousy inflation has gotten and how strong the labor market is.
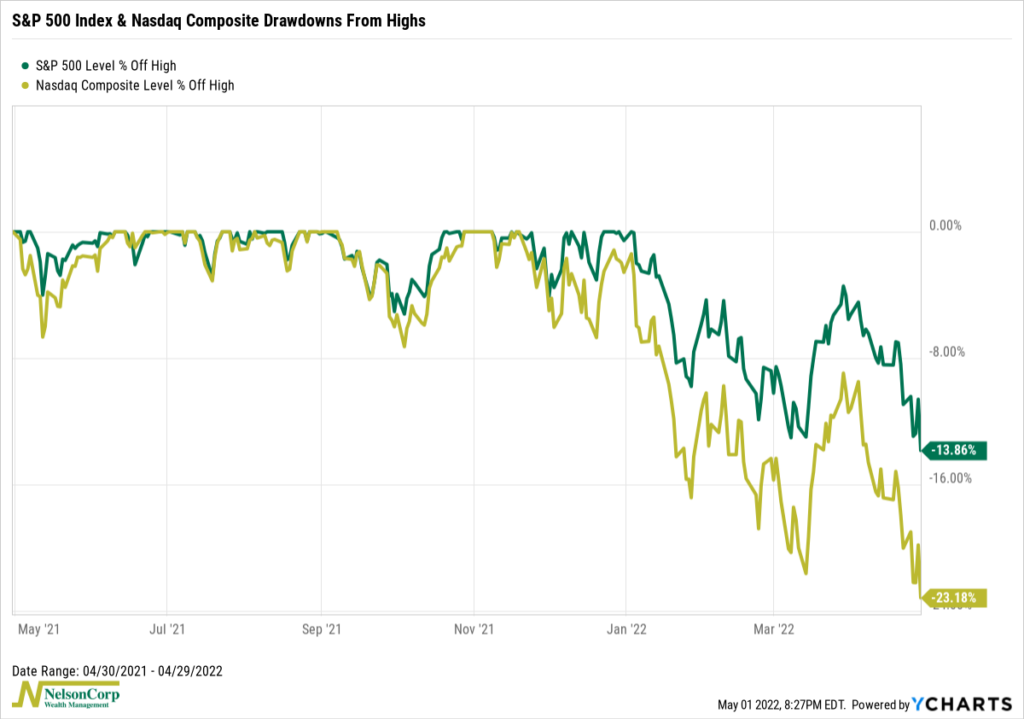
As for the stock market’s price action, well, I probably don’t need to tell you that it has been rough this year. After last week’s decline, the S&P 500 index is now 13.86% lower than its all-time high, and the tech-heavy Nasdaq Composite has been crushed, down 22.18% off its high.
Okay, surely there are some bright spots in the market, though, right?
If you squint, you can catch a glimpse of it in the investor behavior side of things. All this adverse price action was bound to influence investor sentiment eventually. And after last week’s washout, investor sentiment is plumbing extreme lows.
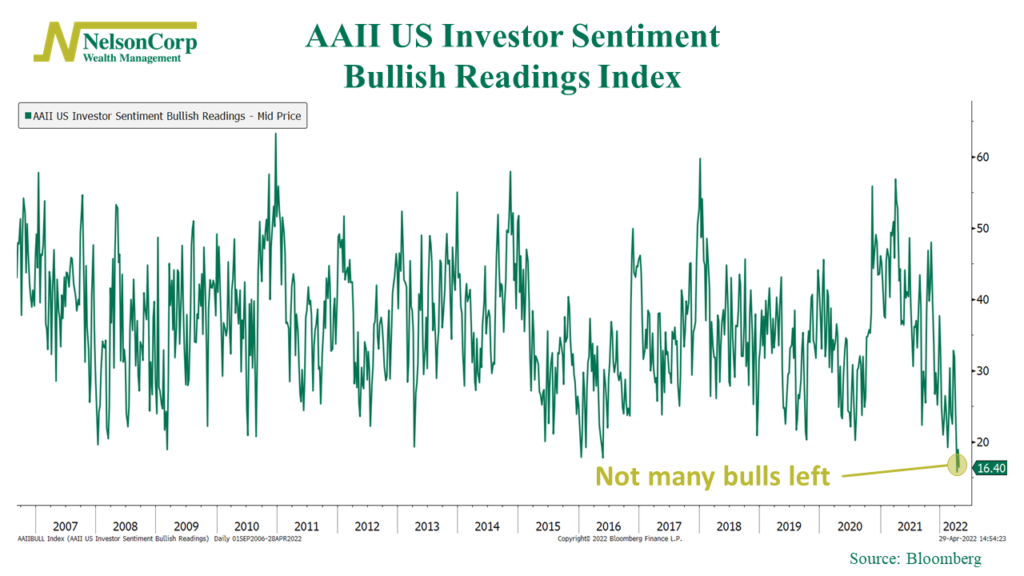
As the chart above shows, the AAII US Investor Sentiment survey shows the lowest level of bullish investors in a long time. This is typically a bullish indicator for stocks from a contrarian point of view. This will be an important area to watch because you don’t need a whole lot to move the market when everyone’s pessimistic and sentiment is in the toilet.
With that said, however, the weight of the evidence is still mostly leaning toward the “be careful” side of things. Investors are nervous for a reason. If anything, the recent action we’ve seen in the market reinforces our base-case outlook that volatility will likely remain high this year and that the range of potential outcomes in financial markets remains exceptionally wide.
This is intended for informational purposes only and should not be used as the primary basis for an investment decision. Consult an advisor for your personal situation.
Indices mentioned are unmanaged, do not incur fees, and cannot be invested into directly.
Past performance does not guarantee future results.