OVERVIEW
Last week, the major U.S. stock indices saw positive gains as volatility decreased on Wall Street. The VIX Index, which measures implied stock market volatility, reached its lowest close since January 2022 at 17.8. The S&P 500 rose by 0.79%, the Dow increased by 1.2%, and the Nasdaq climbed by 0.29%.
Foreign stocks also performed well, with developed country stocks gaining 2.13% and emerging markets increasing by 1.36%.
However, the bond market was less rosy, with the benchmark 10-year Treasury rate rising by 11 basis points to 3.52%. Intermediate-term bond prices fell by 1.23%, and long-term Treasury bonds decreased by 3.24%. Corporate bonds had varied performance, with investment-grade issues decreasing by 0.33% and high-yield (junk) issues rising by 0.76%.
Real estate experienced declines in the range of 1.5%, while commodities saw broad increases of about 1.5%. Oil led the way with a rally of approximately 2.6%, while gold fell by 0.52% and corn decreased by 1.2%. The U.S. dollar weakened by approximately 0.22%.
KEY CONSIDERATIONS
Bullish Potential – In our featured chart this week, we highlighted the latest inflation data showing that prices have continued to decelerate on a year-over-year basis. While still higher than desired, it is evident that inflation is moving in the right direction.
This slowing inflation—and its cousin, falling interest rates—is a significant factor contributing to the stock market rally that began in October of last year. But another sometimes overlooked aspect has helped, too: a weaker U.S. dollar.
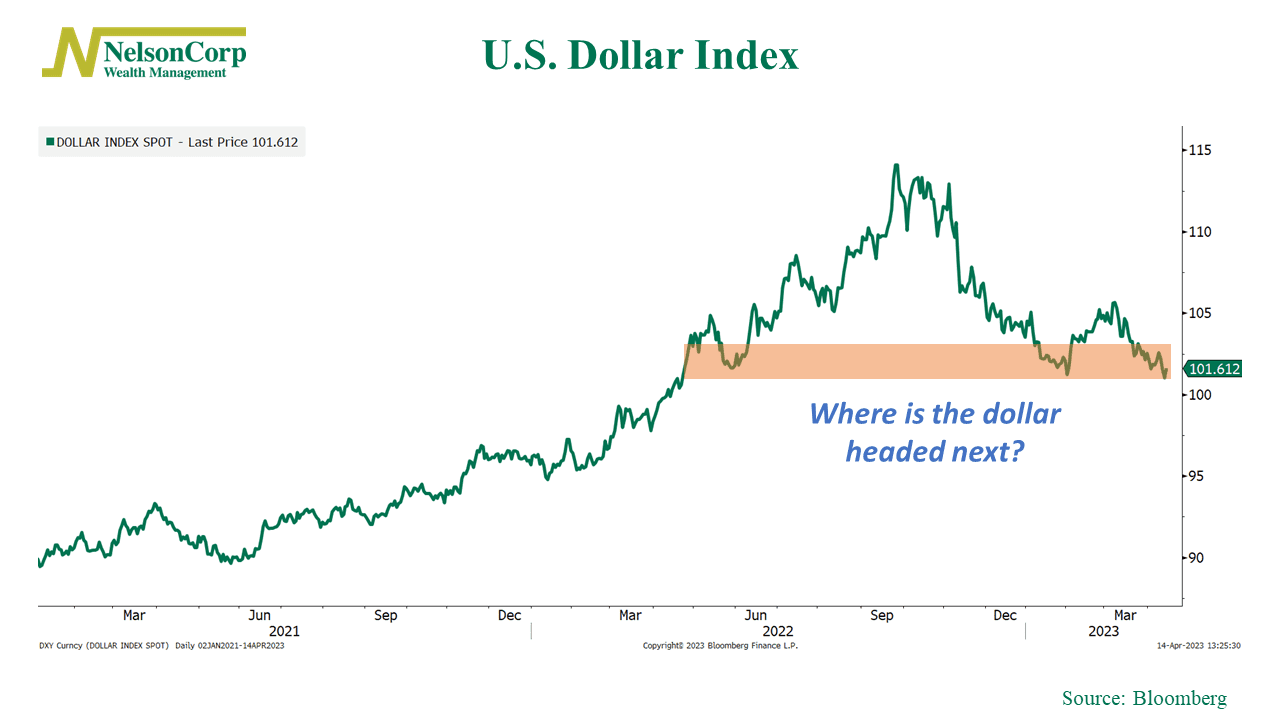
The chart above illustrates the performance of the U.S. Dollar Index over the past few years. It reached a peak in September 2022 but has been trending downward ever since. Although it experienced a brief surge in February, it has consistently closed lower for the past five weeks—and is currently trading at its lowest level in almost a year.
In other words, as highlighted on the chart, the U.S. dollar is at a major inflection point. A stronger dollar was a significant headwind for stocks and other risk assets over the past two years, so a break below these levels could be interpreted as a bullish signal for the stock market.
This bullish sentiment is backed up by the following indicator that we use to measure the stock market’s “trend.” Specifically, it looks at the 6-month moving average of global stock prices and then adds standard deviation brackets to determine overbought/oversold levels.
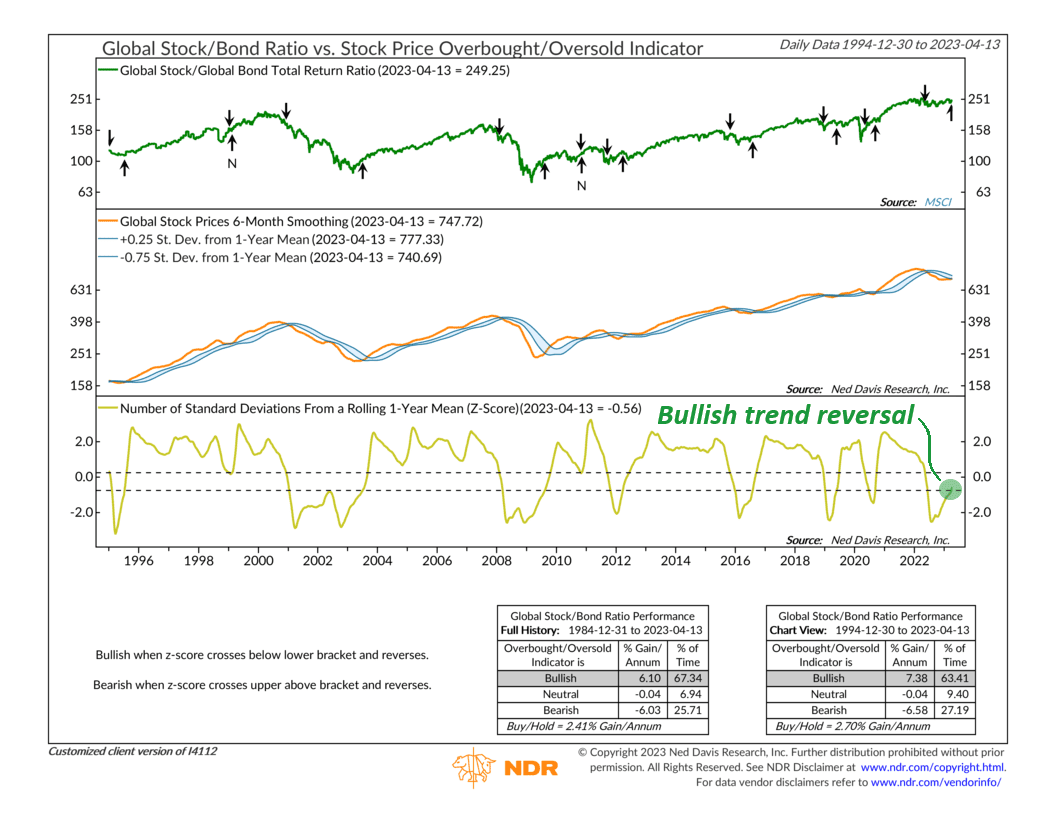
Last year, the indicator went as low as 2.5 standard deviations below its 1-year average, indicating an extremely oversold market. However, according to the rules of the indicator, a subsequent rise above the lower bracket would trigger a bullish signal for global stocks relative to bonds—and that’s exactly what happened a few weeks ago.
So, the bottom line is that inflation, interest rates, and the dollar are all going down, and therefore the stock market has been going up. Whether that continues to be the case remains to be seen. But these factors collectively have indicated positive momentum for the stock market, and investors will want to keep an eye on these dynamics in the coming weeks and months.
This is intended for informational purposes only and should not be used as the primary basis for an investment decision. Consult an advisor for your personal situation.
Indices mentioned are unmanaged, do not incur fees, and cannot be invested into directly.
Past performance does not guarantee future results.