OVERVIEW
The major U.S. stock indices put in mixed performances last week. While the S&P 500 Index gained a moderate 0.36% and the Nasdaq Composite surged 2.15%, the Dow Jones Industrial Average lost 0.13%.
The gains came mostly from growth stocks, with the Russell 3000 Growth Index notching a 1.6% gain. By contrast, the Russell 3000 Value Index fell 0.15%. Large-cap stocks rallied 0.43%, while small-cap stocks traded 0.04% lower.
Foreign stocks were similarly mixed. The MSCI EAFE index of developed country stocks declined 0.68%, whereas the MSCI EM index of emerging market stocks increased 0.91%.
Bonds traded lower as the yield on the 10-year Treasury rose to 2.8%, up from 2.6% the week prior. Intermediate-term Treasuries declined 1.12%, and long-term Treasuries fell 1.61%. Although investment-grade corporate bonds dropped 0.89%, high-yield (junk) bonds rose 0.66%. Municipal bonds declined 0.67%, and TIPS fell 2.6%.
Real assets had a rough week, with real estate declining 1.65% and commodities dropping 3.26% broadly. Most of this was due to the 8.34% drop in oil prices. Corn also fell about 1%, whereas gold rose around 0.5%. And the U.S. dollar—up over 11% this year—rose another 0.74% last week.
KEY CONSIDERATIONS
Congestion – The stock market ran into some turbulence last week.
As I show on the chart below, the area between 4100 and 4200 appears to be an area of congestion for the S&P 500 index.

Two months ago, the May rally sputtered out in this region. The S&P 500 tried to break above 4200 but ultimately failed, and the index turned lower.
Fast forward to today, and the index is back in that same trading zone after an undeniably strong rally from the mid-June low.
But, yet again, the market is hitting a lot of resistance here.
So, what is different this time that could help the stock market break out to the upside?
Well, it does appear that credit spreads are peaking.
As shown in the chart below, U.S. investment-grade corporate, high-yield, and mortgage-backed option-adjusted credit spreads have turned a corner and are now falling from their recent peaks. In other words, investors are no longer demanding as high a premium to hold these riskier bonds relative to safe Treasuries as they were a few months ago.
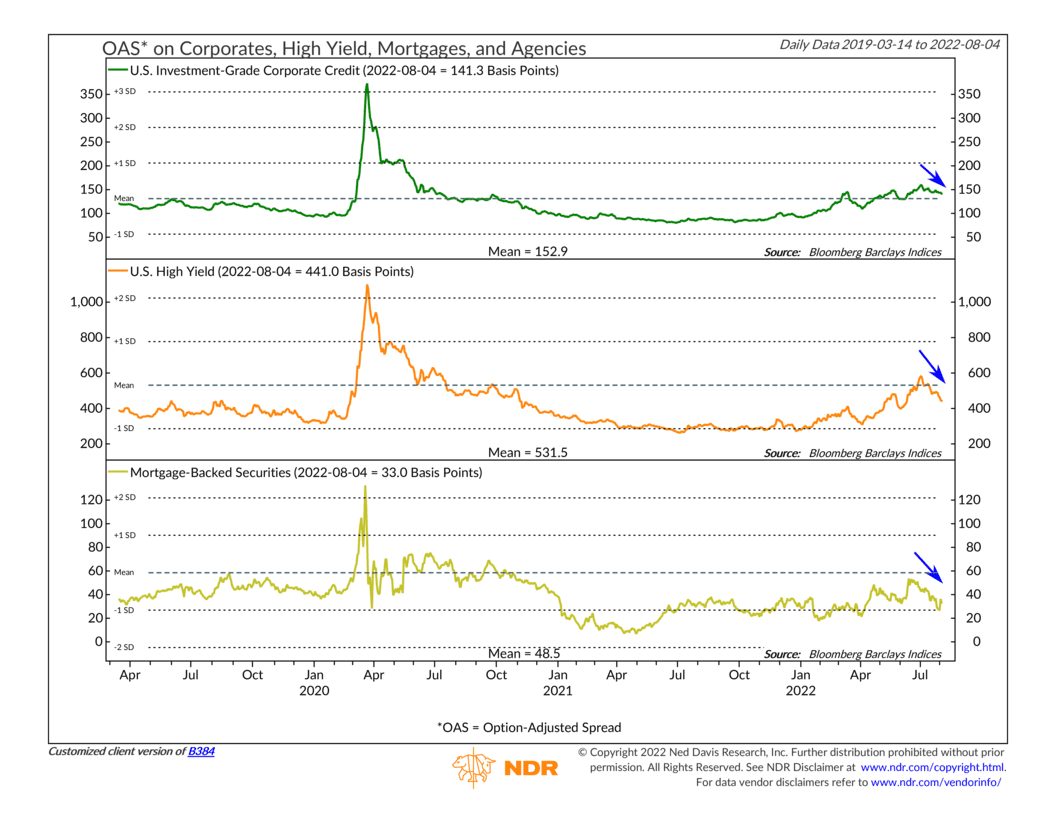
What this likely means is that fixed-income investors are reducing their odds of a major financial disaster. This tends to be a positive sign for equity markets.
So, perhaps the worst is behind us?
Maybe.
But there are still some worrisome signs out there.
For example, one area of concern that we’re seeing is that short-term sentiment has spiked dramatically in recent weeks.
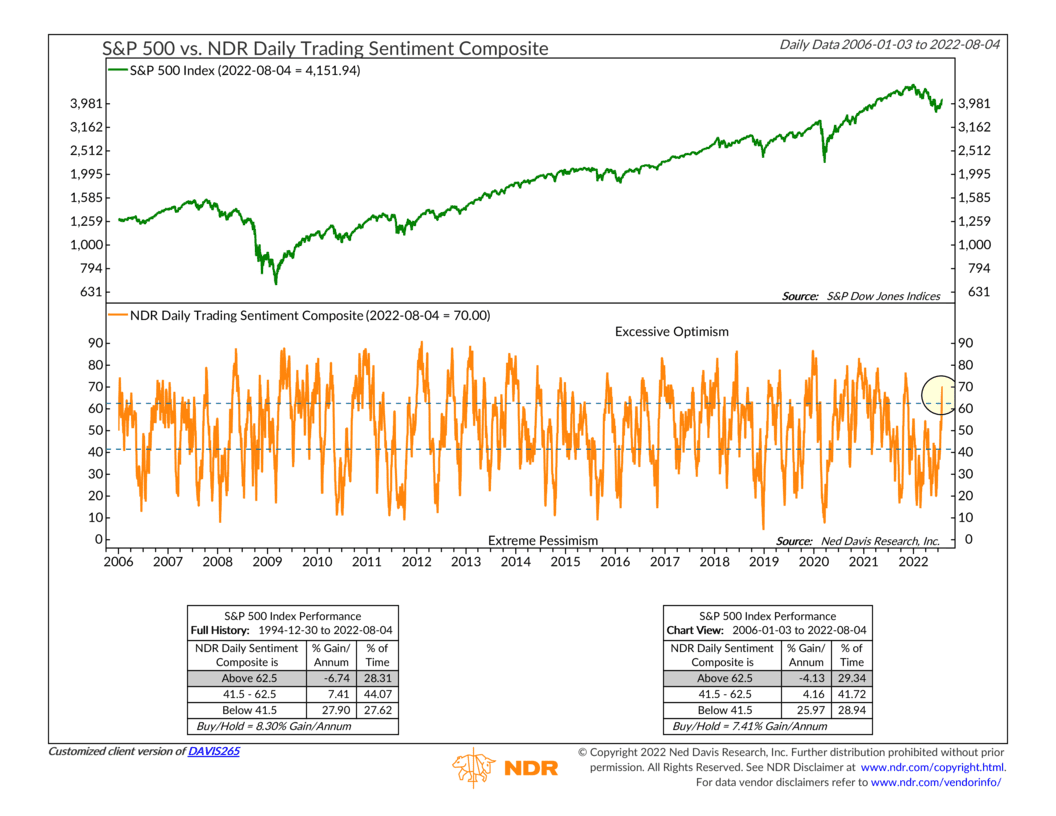
The NDR Daily Trading Sentiment Composite, shown on the chart above, measures short-term sentiment in the market. It climbed into its excessive optimism zone on August 1st. The last time it was this high was November 2021, right before the market peaked and started tumbling.
Such a quick reversal to excessive optimism like this could imply that last month’s rally was little more than a sentiment swing. This might leave the market vulnerable to another leg down when the next piece of bad news comes.
Ultimately, the weight of the evidence from our indicators is what matters the most. And since the market’s price movements hold the greatest importance in our analysis, whether stocks can break out of this current area of congestion will go a long way towards determining how much improvement we’ll ultimately see in our models.
This is intended for informational purposes only and should not be used as the primary basis for an investment decision. Consult an advisor for your personal situation.
Indices mentioned are unmanaged, do not incur fees, and cannot be invested into directly.
Past performance does not guarantee future results.