OVERVIEW
The U.S. stock market had another strong outing last week, with the S&P 500 Index rising 1.23%, the Dow Jones Industrial Average gaining 1%, and the Nasdaq Composite rising 1.73%.
The most significant gains were centered around small-cap stocks, which rose 3.6%, and value stocks, which rose 1.95%.
Foreign equity markets outperformed U.S. stocks. Developed country stocks gained 2.09%, and emerging market stocks rose 2.4%.
Treasury bonds suffered declines as the yield on the U.S. 10-year Treasury note closed above 1.2% on Friday.
Investment-grade corporate bonds also fell about 0.09%. However, high-yield (junk) bonds gained about 0.3%, and municipal bonds rose about 0.23%.
Oil had another big week, gaining about 4.5%. Gold rose about 0.56%. Corn, however, fell around 2% for the week.
After a couple of weeks of strength, the U.S. dollar weakened by about 0.6%.
KEY CONSIDERATIONS
Ending on a High Note – The U.S. stock market ended another strong week at all-time highs once again. A few things occurred at the end of the week that has us feeling pretty good about stocks in the near term.
For starters, bond yields continue to march higher, particularly at the longer end of the yield curve. On Friday, the 30-year Treasury bond rate hopped above 2% for the time in a year.
This is bad news for bonds because their prices fall as yields rise. As seen in the chart below, long-term Treasury bond prices reversed around six months ago and haven’t stopped descending.
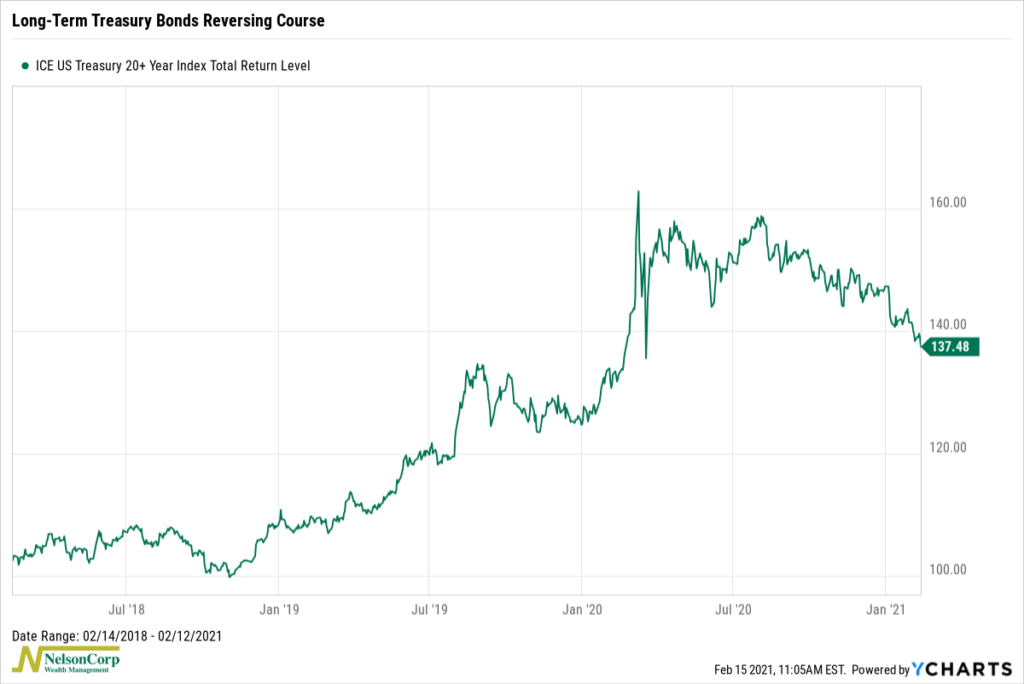
While bad for holders of long-term bonds, this is good for stock prices. Long-term Treasury bond prices have an inverse correlation with global stock prices. In other words, when long-term Treasury bonds fall, stocks tend to rise and vice versa. Therefore, this reversal in bond prices over the past six months is a confirmation of a “Risk-On” trade, where we favor risk assets such as stocks.
So stocks look favorable to bonds on a relative basis. But what about the price action of stocks by themselves?
Here things look good, too. Again, on Friday, we got a positive “thrust” signal from our 10-day Advance/Decline indicator, as shown in the chart below. This indicator plots the ratio of the 10-day total number of stocks rising in price (advancing) to the 10-day total number of stocks declining in price (declining). When the advancing issues are outpacing the declining issues by a ratio of more than 1.9, it triggers a positive signal.
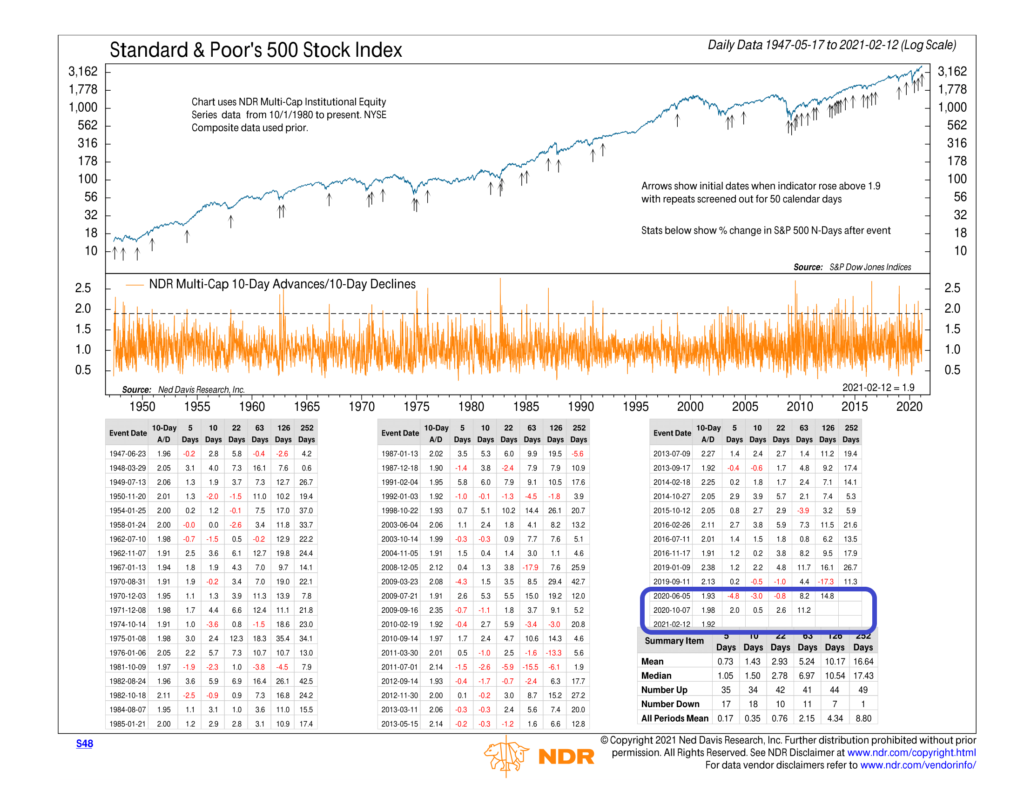
This indicator has given two other positive thrust signals since the recovery started back in March. Both times, the S&P 500 stock index returned around 8% to 11% during the next three months after the signal. Even looking at the data back to 1950, the median 3-month return after a positive signal has been around 7%.
The takeaway is that even with stocks at all-time highs, there are reasons to believe that stocks can still rise higher from here. The sentiment and valuations side of things is less bullish; however, on a relative basis (stocks vs. bonds) and an internal basis (decisive price action), stocks look favorable in the near term.
This is intended for informational purposes only and should not be used as the primary basis for an investment decision. Consult an advisor for your personal situation.
Indices mentioned are unmanaged, do not incur fees, and cannot be invested into directly.
Past performance does not guarantee future results.