OVERVIEW
U.S. stocks took a slight step back last week, with the S&P 500 dropping 0.13%, the Dow falling 0.46%, and the Nasdaq declining 0.25%.
Small-cap and mid-cap stocks, however, rose 0.16% and 0.91%, respectively. Value stocks also edged higher by about 0.07%.
Developed country stocks fell 0.5%, a little worse than their U.S. counterparts. Emerging market stocks, however, gained 0.32%.
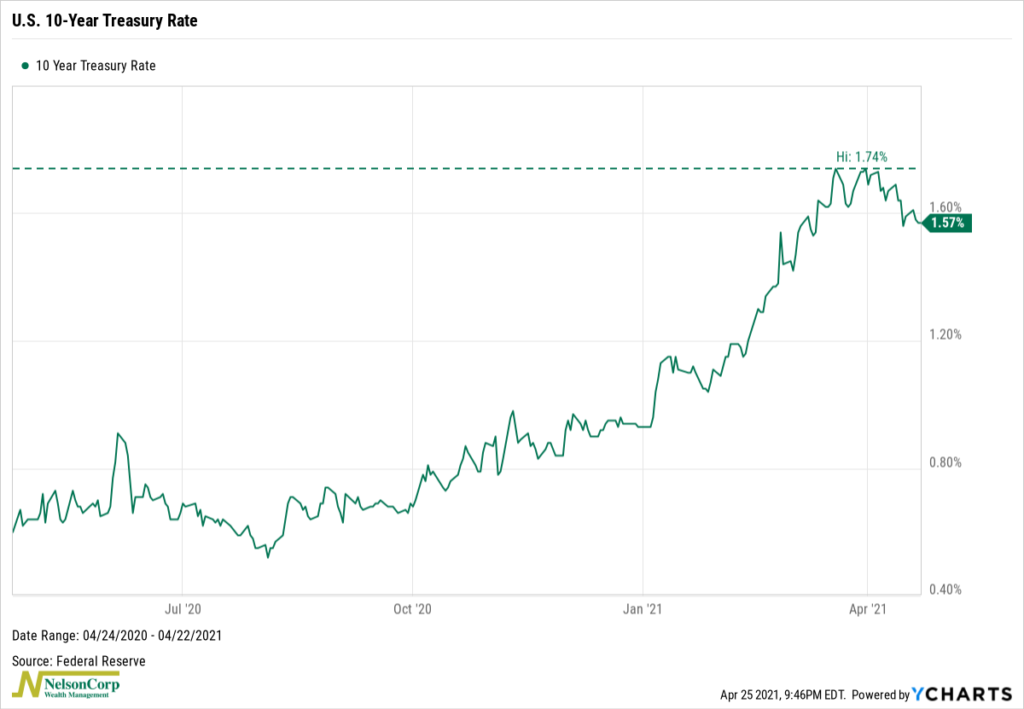
The U.S. 10-year Treasury yield fell to 1.57% from 1.58% a week earlier, resulting in moderate gains for Treasuries as well as corporate and municipal bonds.
Real estate rose about 1.73%, and commodities gained around 2.17%.
And finally, the U.S. dollar weakened, declining about 0.8% for the week.
KEY CONSIDERATIONS
Flush with Cash – Interest rates are taking a breather after their ferocious run-up earlier this year. The U.S. 10-year Treasury rate reached roughly 1.74% about a month ago, but it has since given back about 17 basis points and currently stands around 1.57%.
To be sure, this could be nothing more than a brief pause before a continued climb upwards. However, there are some other forces at play that are pushing back against the rise in rates.
Take banking liquidity, for example. One of the after-effects of all the stimulus this past year is that banks have found themselves flush with deposits. The loan-to-deposit ratio for U.S. banks—a commonly followed metric for bank liquidity—hit an all-time low recently. (A lower number represents more liquidity since that means deposits are growing faster than loans).
While this means that banks have plenty of room to lend, it also means that banks are putting more money into investments (i.e., bonds) and less money into loans. Consequently, this reduces the upward pressure on interest rates since rates fall as bond prices rise.
The chart below spells this out nicely and shows that increased banking liquidity is ultimately bullish for the stock market.
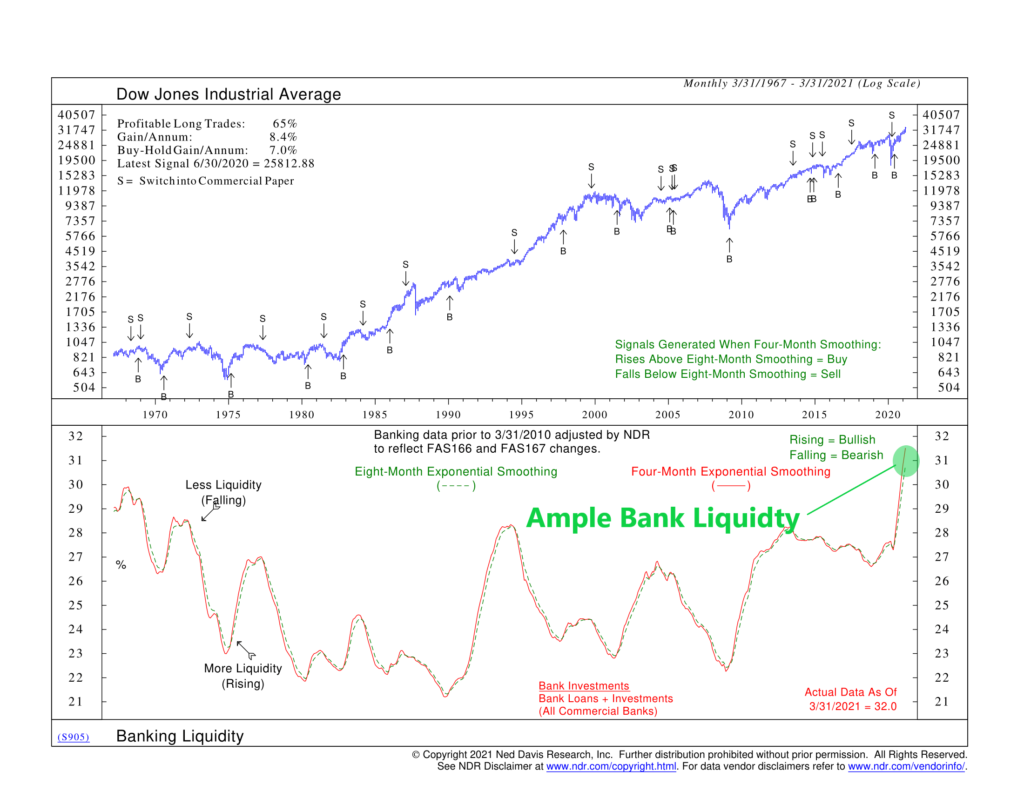
This chart essentially shows the same thing as the loan-to-deposit ratio but in a slightly different way. It takes bank investments (primarily consisting of U.S. Treasuries and municipal bonds) and divides them by bank credit (that is, investments plus loans). (It also uses a pair of moving averages of this ratio to smooth out fluctuations and help gauge the underlying trend of banking liquidity). Therefore, a higher number for this metric is a sign of greater banking liquidity.
The analysis reveals that if you had followed the buy and sell signals from the strategy employed on the chart, you would have had a slight edge in performance versus just buying and holding the stock market via the Dow Jones Industrial Average.
This conclusion is in line with the overall message from the other financial liquidity indicators that we utilize—all of which are offering similar signs of ample liquidity and thus positive signals for stocks.
This is intended for informational purposes only and should not be used as the primary basis for an investment decision. Consult an advisor for your personal situation.
Indices mentioned are unmanaged, do not incur fees, and cannot be invested into directly.
Past performance does not guarantee future results.