OVERVIEW
U.S. stocks were mixed last week, with the S&P 500 and Nasdaq gaining 0.41% and 1.85%, respectively, but the Dow fell 0.8%.
Growth stocks had a strong week, rising 1.95%, whereas value stocks slipped and fell 0.4%.
Internationally, developed country stocks rose a modest 0.33%, and emerging market stocks eked out a small gain of 0.03%.
Bonds had another good week as the yield on the 10-year Treasury note fell to 1.45%. Long-term Treasuries rose 1.74%, investment-grade corporate bonds rose 0.87%, high-yield (junk) bonds gained 0.5%, municipal bonds increased 0.35%, and inflation-protected Treasuries (TIPS) rose 0.15%.
Real estate continues to do well this year, notching another 2.48% gain last week. Commodities rose a more modest 0.32% last week, with oil gaining 1.71%. Gold fell 0.66%, and corn plummeted 7.76% for the week.
The U.S. dollar ticked up slightly, rising 0.45% for the week.
KEY CONSIDERATIONS
Fund Flows Fading – The S&P 500 stock index finally reached an all-time high last week after treading water for about a month. The flow of money into stock funds, however, has dropped to year-to-date lows. What gives?
Well, we like to think of fund flows in a contrarian manner, meaning we take the opposite position of the crowd when things get too extreme. More specifically, we feel it’s best to go with the flow until an excessive threshold is breached—and then we lean in the opposite direction.
For example, the chart below shows the four-week total of money flowing into equity (stock) funds. The upper and lower dashed lines represent the extreme thresholds mentioned above. When the four-week total of fund flows rises above the upper line, it’s a sign of excessive optimism. The S&P 500 stock index tends to do poorly in this zone. But when fund flows fall below the lower line, it’s a sign that pessimism has gone too far. Returns are much better in that scenario.
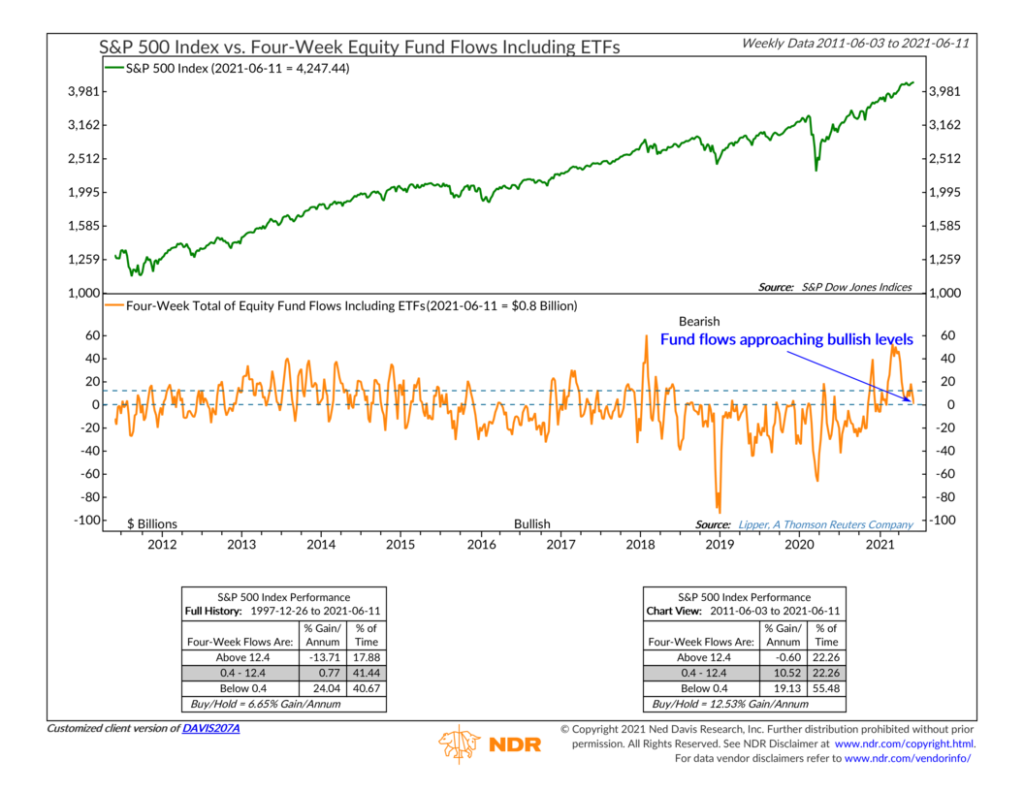
Over the past four weeks, only about $0.8 billion flowed into equity funds (including ETFs). That’s down from a high of about $53 billion a few months ago. Interestingly, most of the S&P 500’s returns this year have come after fund flows peaked near the beginning of March and started falling.
According to the indicator, the four-week total for stock fund flows is currently in a neutral zone, meaning between the upper and lower sentiment lines. Stock returns have been moderate when in this neutral zone. But if fund flows fall below the lower sentiment line, it has historically been the most bullish scenario for stocks—something to keep in mind.
This is intended for informational purposes only and should not be used as the primary basis for an investment decision. Consult an advisor for your personal situation.
Indices mentioned are unmanaged, do not incur fees, and cannot be invested into directly.
Past performance does not guarantee future results.