OVERVIEW
The U.S. stock market surged higher last week as the S&P 500 rose 1.96%, the Dow gained 1.08%, and the Nasdaq increased 2.84%.
Growth stocks led the way, rising 3.33%. Value stocks gained a more moderate 0.95%. Small-cap stocks, which rose 2.15% for the week, recovered a little bit of ground after falling for three weeks straight.
International stocks lagged the U.S. market. Developed country stocks rose 0.19%, and emerging market stocks fell 2.15% for the week.
The yield on the U.S. 10-year Treasury nudged up to 1.28% from 1.2% the prior week.
Real estate gained about 0.5% for the week. Commodities were more mixed, with oil gaining 0.7%, gold falling 0.73%, and corn dropping 1.63%.
The U.S. dollar rose about 0.25% to end the week.
KEY CONSIDERATIONS
I’m Buying What You’re Selling – Coming into the week, it didn’t feel like the stock market would be setting new all-time highs anytime soon. Stocks had sold off through Monday, and our 85-day Stochastic indicator, shown below, triggered a “sell” signal after falling to its lowest level since May of last year.
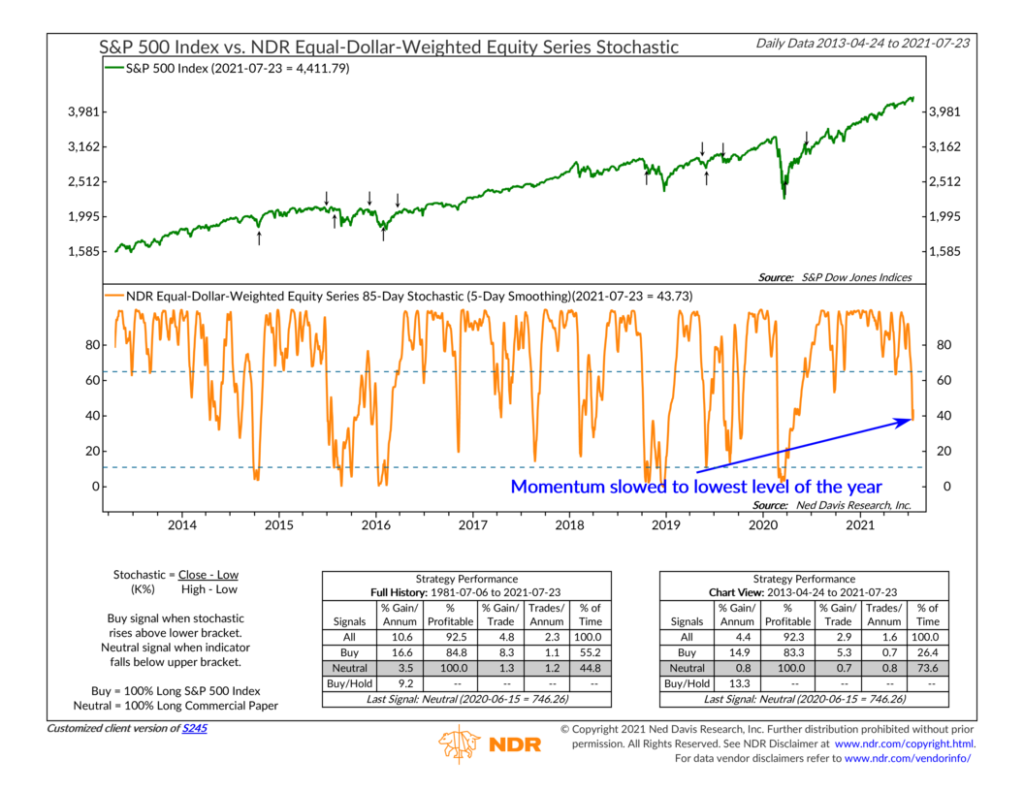
This indicator measures whether stocks are closing near the top or bottom of their recent price range. A fall below the upper bracket signals waning momentum, a warning that stock prices might be reversing.
But, the last two times this measure fell below the upper bracket, it quickly reversed back above it. False alarms. They happen.
So, was this just another false alarm?
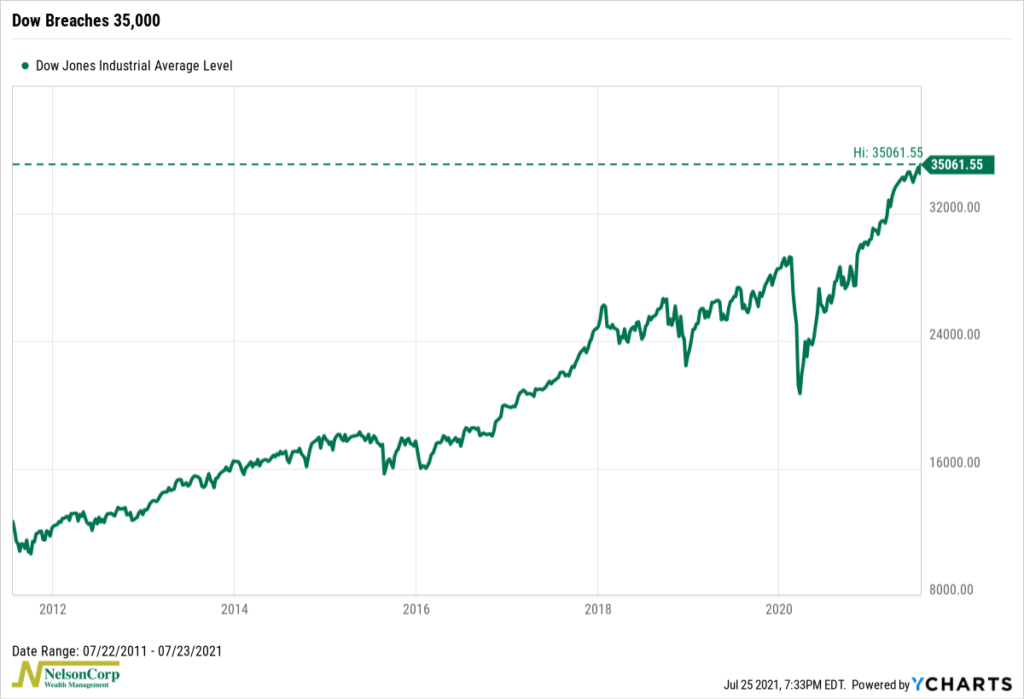
Maybe. To be sure, this decline was much deeper than the other two declines. And there’s no doubt about it; price momentum has certainly slowed. But, as you might have noticed, the rest of the week saw quite the turnaround. After four consecutive days of gains, the Dow ended the week at a record high—above 35,000 for the first time!
So, what’s going on? One explanation is that there is a lot of demand right now to buy stocks. Investors are eager to buy at even the slightest hint of a pullback. Our Volume Demand and Supply indicator below demonstrates this nicely.
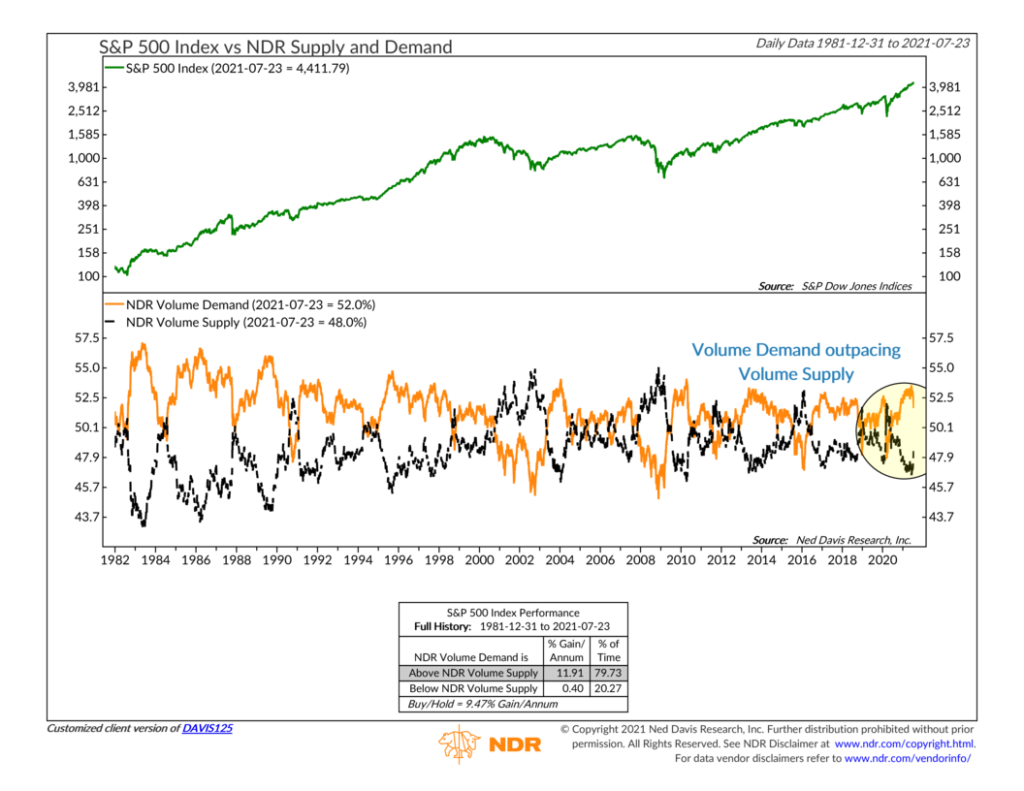
This indicator measures stock market volume, which refers to the number of shares traded in a stock during a given period of time. If a stock increases in price over a 10-day period, its total volume gets counted in what we call Volume Demand. This is represented as the orange line on the chart. But, if a stock falls in price, its volume is included in the Volume Supply line (the black line on the chart).
Looking at the chart, we see quite the gap. It’s been enormous all year! It came down a bit after the recent sell-off, but it’s still quite wide. When Volume Demand is this much greater than Volume Supply, it suggests that investors are enthusiastic about the stock market.
This, I think, goes a long way to explaining why investors have been so quick to “buy to dip” lately.
This is intended for informational purposes only and should not be used as the primary basis for an investment decision. Consult an advisor for your personal situation.
Indices mentioned are unmanaged, do not incur fees, and cannot be invested into directly.
Past performance does not guarantee future results.