OVERVIEW
U.S. stocks were mostly flat to down last week. The S&P 500 stayed about the same from a week earlier, rising just 0.02%. The Nasdaq did less well, falling 0.39%, and the Dow did even worse, down 0.5%.
Large-cap and value stocks were where the gains were at, gaining 0.14% and 0.4%, respectively.
International stocks didn’t fare any better than the U.S., with developed country stocks falling 0.85% and emerging markets dropping 0.4%.
The rate on the U.S. 10-year Treasury note rose from 1.56% a week earlier to 1.63% by Friday’s close. Most bonds were down as a result, except for high-yield bonds and TIPS, which both rose around 0.2% for the week.
Real estate had a good week, climbing about 1.33%.
And despite the U.S. dollar’s gain of about 0.5%, commodities did even better, rising broadly by more than 2.2% for the week.
KEY CONSIDERATIONS
Like Chalk and Cheese – Much like the horses in the Kentucky Derby this past weekend, U.S. companies have come out of the gate with a bang this earnings season. According to FactSet, 60% of the companies in the S&P 500 have reported their profit numbers for the first quarter of 2021, and 86% of them have beat Wall Street’s expectations. If that rate continues, it will be the highest percentage on record!
However, the S&P 500 index, the standard benchmark for the U.S. stock market, hasn’t really done much in the past two weeks. On the surface, momentum appears to be waning.
But not to worry. Much of this quarter’s earnings surprises were likely priced in by investors over the past month and a half. From March 4th to April 16th, the S&P 500 rose about 11%, which accounts for nearly all the index’s gains this year. So, while Wall Street analysts have been surprised by stronger-than-expected earnings, stock investors have been less stunned.
Does that mean all the good news has been priced in? Maybe. But we still see reasons why the stock market can go higher from here. Take falling correlations, for example. The chart below shows the median S&P 500 stock’s 63-day correlation with the S&P 500 index itself. In other words, it shows how closely the average stock is moving in relation to the overall market over the past three months.
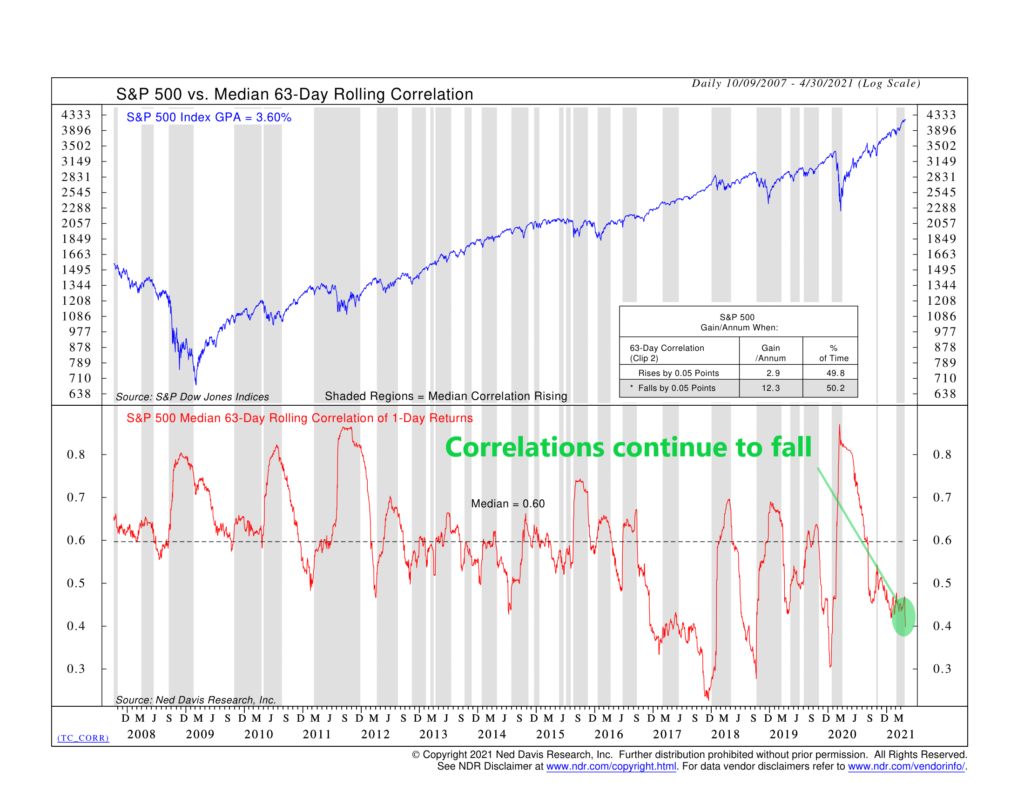
This measure has fallen precipitously since the sell-off in March last year, which has benefited stocks greatly. It triggered a brief warning signal earlier this year with the sell-off in high-flying tech stocks. But it has fallen since then and is back on a bullish signal.
A spike in correlations signifies that fear is taking over, so falling correlations mean fear is subsiding, which is good. Investors are now digesting companies’ earnings and business prospects individually instead of lumping them all into one group, which they tend to do during selling panics.
In the UK, when two things are entirely different from each other, they say they are like “chalk and cheese.” More and more, this is how investors see the various companies that compose the stock market. Historically, we find this is good for stock returns overall.
This is intended for informational purposes only and should not be used as the primary basis for an investment decision. Consult an advisor for your personal situation.
Indices mentioned are unmanaged, do not incur fees, and cannot be invested into directly.
Past performance does not guarantee future results.