OVERVIEW
The S&P 500 index of large U.S. stocks fell 3.05%, its seventh straight week of declines. That’s the index’s longest losing streak since the dot-com bubble burst in 2001. The Dow Jones Industrial Average fell 2.9%, its eighth-straight weekly decline. The Nasdaq also posted an eight-week in a row skid, falling 3.82% for the week.
International stocks did better, however. Developed country stocks rose 1.38%, and emerging markets gained 3.06%.
U.S. Treasury bonds were a haven for investors last week. The 10-year Treasury yield fell to 2.85% from 2.92% the week before, resulting in long-term Treasury gains of around 2.08%. Investment-grade bonds also rose by around 0.44%. High-yield bonds, however, fell 0.69%. TIPS edged lower by about 0.09%.
Real estate got crushed, falling 2% for the week. Commodities, however, gained about 1.74% broadly. Oil was up 0.46%, gold rose 1.85%, but corn was down 0.32%. And finally, the U.S. dollar weakened, down around 1.54% relative to the world’s major currencies.
KEY CONSIDERATIONS
Losing Gains – When you’re in a bull market, you get this feeling that even when the market is down that day—or week, or month—that it’s bound to go right back up. You can sense the bias in the market, that feeling in your gut that stocks just want to go up. And inevitably, they do.
But when you’re in a bear market, everything is reversed. What used to feel like a sure dip-buying opportunity suddenly feels less cozy. Now stocks just want to go down. And even on the days when it looks like the market might be trying to turn the corner, it does an about-face and ends in negative territory.
So far this year, the stock market has acted more like that second description, the bear market description. But it’s not just a feeling; we can put some numbers on it.
The chart below shows the number of days over a rolling 100-trading day period that the Nasdaq Composite—a broad stock market index more heavily weighted toward technology companies—has traded in positive territory on an intraday basis but finished the day in negative territory. In other words, it counts the days when the market couldn’t hold on to its gains for the day.
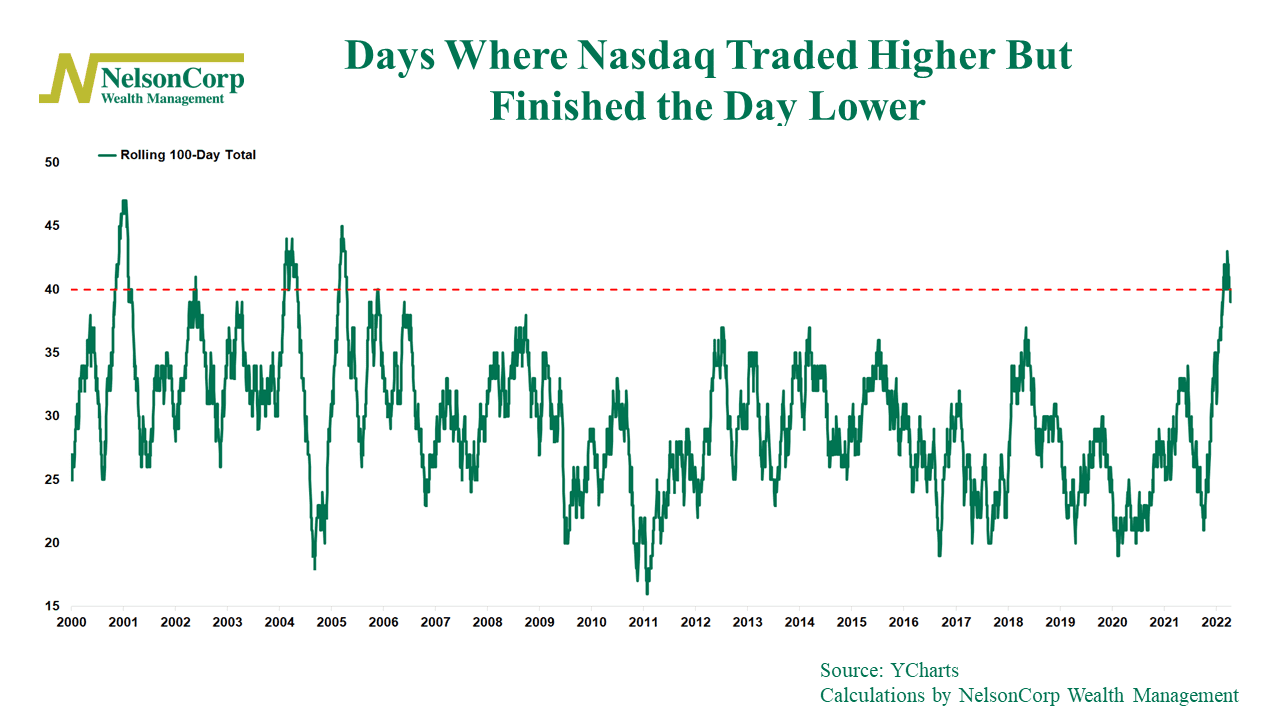
As you can see from the chart, it’s been in the 40-day range for a few months now. This means that over the past 100 trading days, roughly 40% of them have been days where the market had a positive gain at some point during the day but couldn’t hold on and would end the day lower than where it closed the previous day. We haven’t seen this type of price action in over 15 years!
Interestingly, in the ten years before the Great Financial Crisis, these types of days were a lot more common, particularly for the Nasdaq. Indeed, this type of price action was prevalent in the bear market that coincided with the Tech Bust in the early 2000s—so that’s a worrisome comparison. But also, the past decade or so has been one of the more accommodative monetary policy environments we’ve ever seen, so that might explain why we haven’t seen it more recently.
Now, accommodative is certainly not how I would describe monetary policy this year. And that is a big reason why stocks are selling off. The Fed has made it crystal clear that it wants to stomp out inflation—and do it quickly. And when the Fed decides to hike rates faster, it has historically been a poor environment for stock returns.
Technically, the Nasdaq Composite has been in a bear market—20% or more off its highs—for many weeks now. Its drawdown is roughly 30% as of last Friday’s close. Also, on Friday, the S&P 500 index—a broad stock market gauge of large U.S. stocks—fell into bear market territory on an intraday basis. However, it reversed course dramatically near the end of the day and closed in positive territory—narrowly avoiding the technical definition of a bear market.
Whether the selling is now over, though, is hard to say. For the most part, the market has been trading with a quitter’s mentality, giving up its gains with ease. If we see that dynamic start to turn, however, it will likely be a sign that the tide is beginning to shift, and a good risk-adjusted buying opportunity might present itself.
This is intended for informational purposes only and should not be used as the primary basis for an investment decision. Consult an advisor for your personal situation.
Indices mentioned are unmanaged, do not incur fees, and cannot be invested into directly.
Past performance does not guarantee future results.