OVERVIEW
The U.S. stock market rallied last week, with the S&P 500 gaining 3.48%, the Dow increasing 3.22%, and the Nasdaq rising 3.37%.
Value stocks outperformed, surging 4.06%, versus the 3.34% gain for growth stocks. Small-cap stocks rose about 3.67%.
As for foreign stocks, there was a 3.74% gain in developed country stocks and a 1.86% increase in emerging market stocks.
Bond prices were mixed for the week. Short-term Treasuries were essentially flat, while intermediate-term Treasuries fell 0.55% and long-term Treasuries dropped 0.43%. However, investment-grade corporate bonds were up 0.15%, and high-yield (junk) bonds rallied 1.74%. Municipals rose 0.34%, and TIPS increased 0.32%.
Real estate had a strong week with a 5.4% gain. Commodities were also up about 2.41% broadly. Oil was the big gainer, up nearly 9%, while gold fell 0.77%. Finally, the U.S. dollar dropped about 0.54%.
KEY CONSIDERATIONS
Low Neutral – When it comes to modeling stock market risk, following the weight of the indicator evidence is the name of the game. And lately, we’ve noticed that the weight of the evidence has converged to what we might call a “low-neutral” environment for stocks.
For instance, we place the most importance on the stock market’s price action or price movements. This is because, at the end of the day, price is all that really matters. And right now, the weight of the price-based indicator evidence points to a low-neutral environment.
As an example, the chart below shows the percentage of individual stocks in the stock market currently trading higher than their average 200-day price. Right now, it’s about 48%.
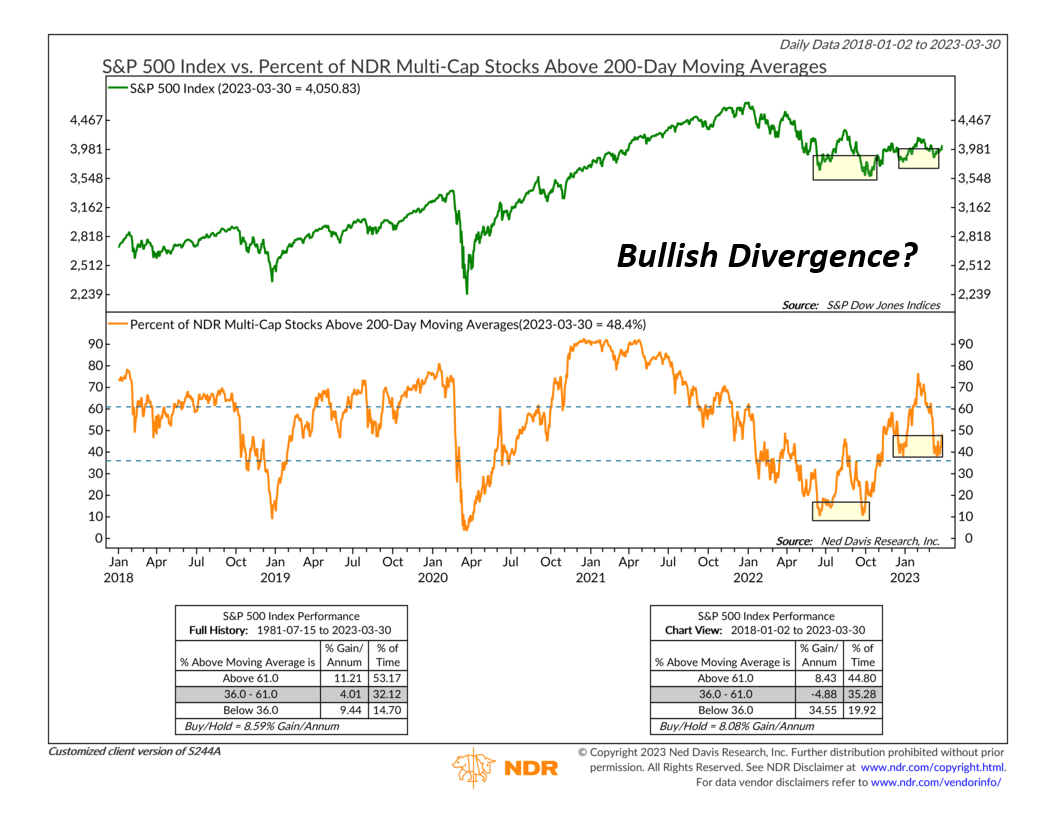
That’s higher than the 36% cutoff that historically defines a market suffering from “bad breadth.” So that’s good. But it’s still well below the 61% cutoff required for a bullish signal, so there’s still room for more improvement.
However, I would note—as highlighted on the chart—that breadth has been stronger during the past two market dips relative to the two major lows reached last year. We call this a bullish divergence, and it could be a tailwind for stocks.
Moving on, another area of the market that we pay close attention to is sentiment. Unlike the market’s price action—which focuses on actual stock price movements—sentiment has to do with investors’ feelings and behaviors. Typically, we view this data through a contrarian lens, meaning high readings (excessive optimism) are bearish and low readings (extreme pessimism) are bullish. And right now, the overall message from the indicator evidence is roughly neutral as well.
For example, the indicator below is designed to highlight short-term swings in investor psychology. It combines several indicators together to paint a broad picture of investor sentiment. And oddly enough, it’s also hovering near levels just below 50%, similar to the breadth measure mentioned above.
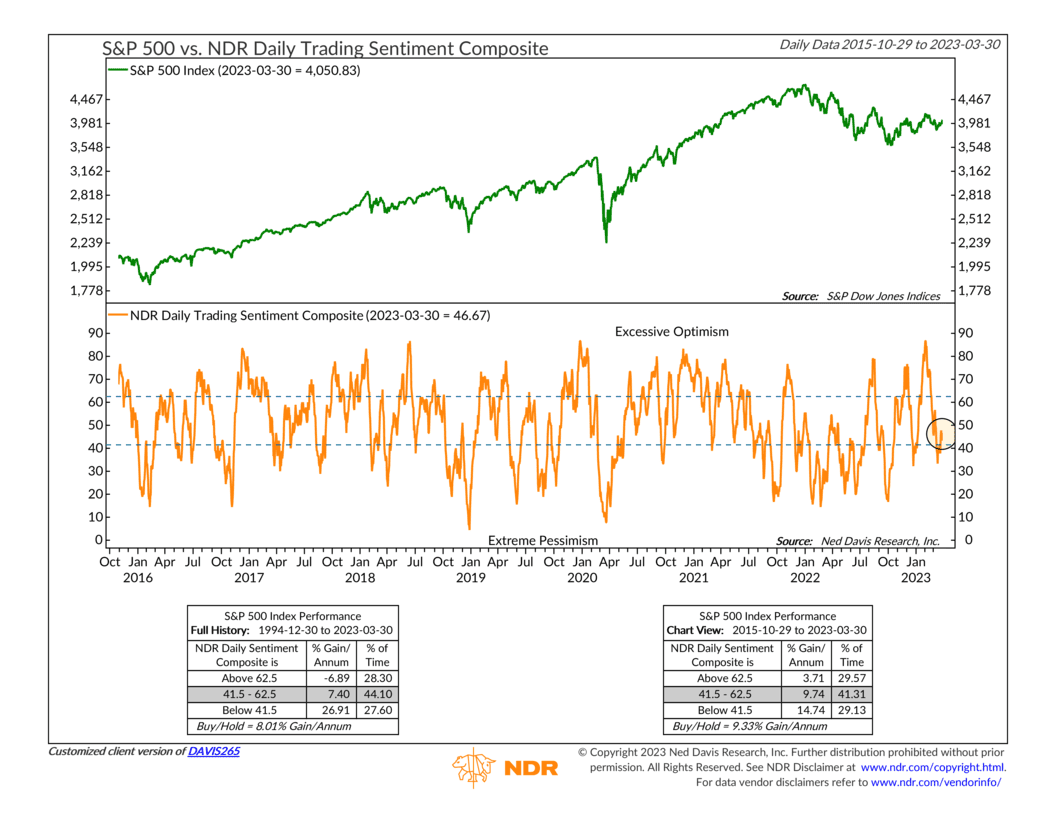
But in this case, the indicator has gone from a positive zone of extreme pessimism to a neutral zone of less pessimism. At any rate, though, the message from the weight of the sentiment evidence is: things are good, but they could be better.
Finally, I’d like to highlight a few observations related to the economic environment, which our indicators suggest is also mostly “low-neutral” at this time.
While we’ve witnessed some model deterioration related to credit spreads recently, we do take heart in the fact that high-yield and investment-grade corporate bond yields—shown below—haven’t suffered through a big “spike” in the way they have in previous periods when the economy went into recession.
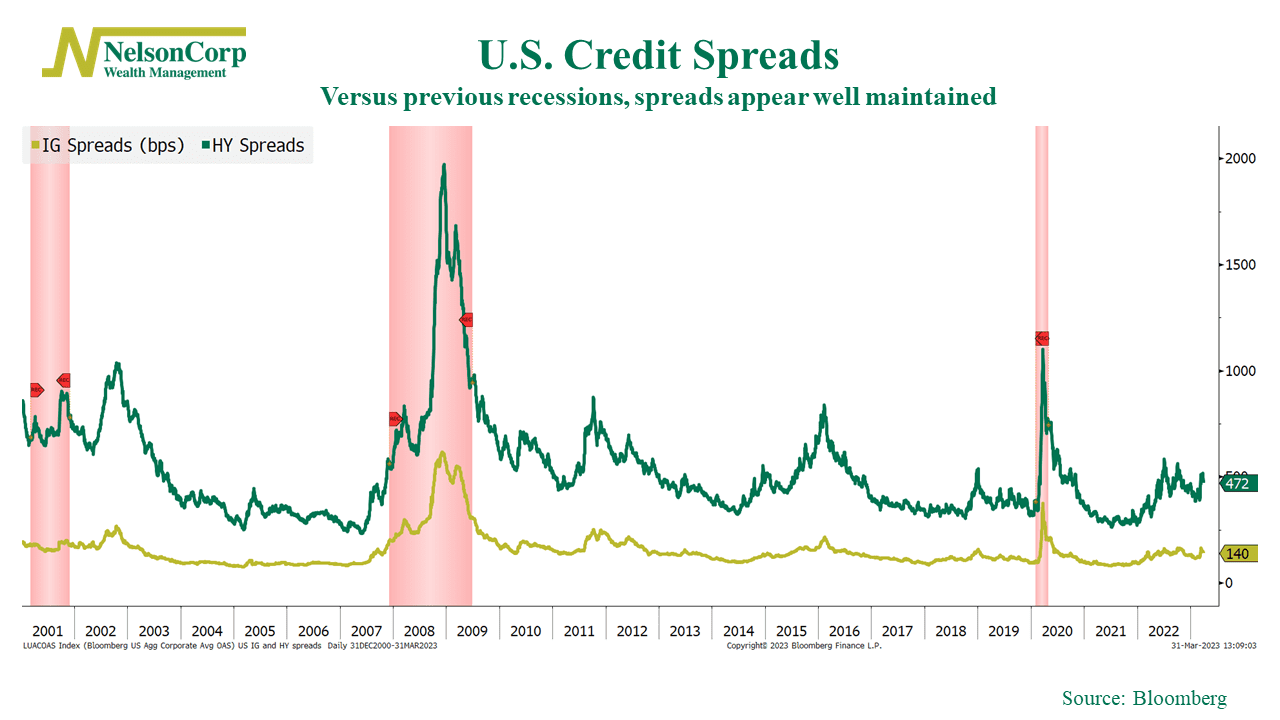
But they are still elevated, so it’s worth watching for further deterioration.
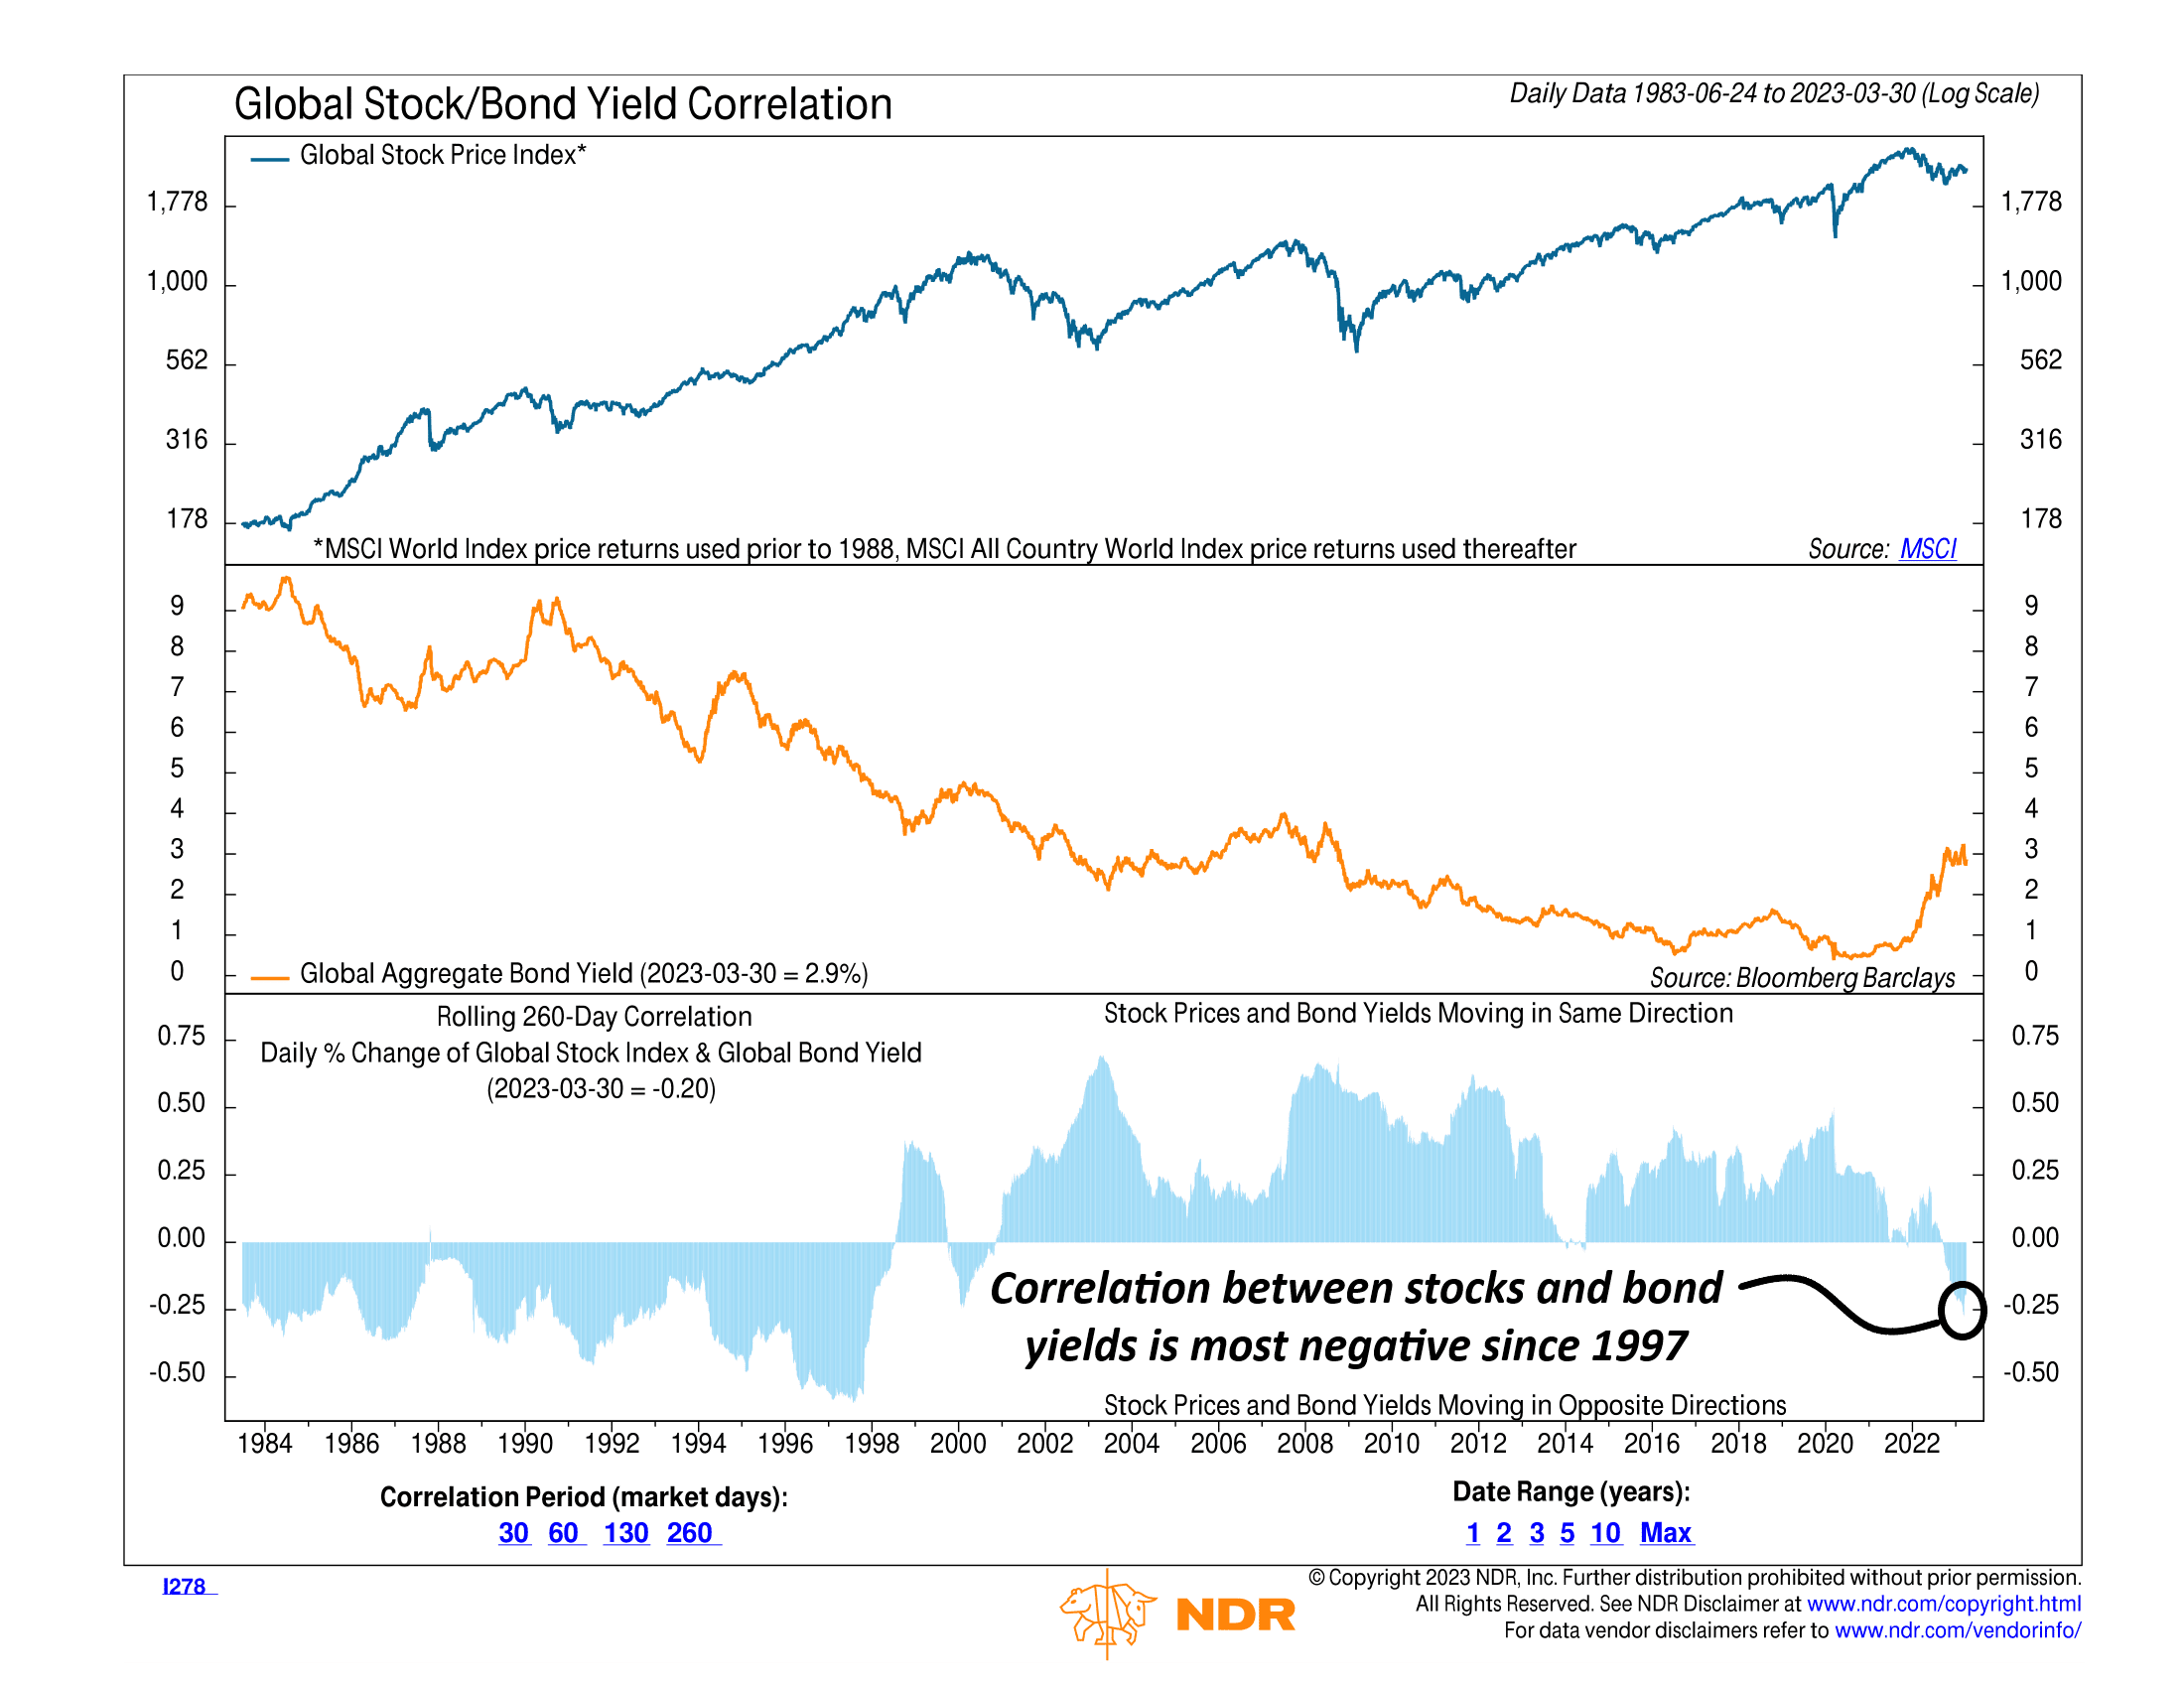
On another note, the inflation data—while still high—seems to be cooling off at an encouraging rate. Interest rates, as a result, have come down from their earlier peaks. And as the chart below highlights, the stock/bond yield correlation is now deeply negative, meaning stock prices and bond yields are moving in opposite directions. Therefore, the implication is that falling rates will remain bullish for stocks—and rising rates bad—assuming the negative correlation continues.
So, the bottom line? The three areas of the market that we model—price movements, investor behavior (sentiment), and the economic environment—have all converged into what we would say is a “low-neutral” environment for the stock market. Given how negative these readings were last year, we see this as likely a positive sign going forward—but, as the neutral reading suggests, caution is still warranted.
This is intended for informational purposes only and should not be used as the primary basis for an investment decision. Consult an advisor for your personal situation.
Indices mentioned are unmanaged, do not incur fees, and cannot be invested into directly.
Past performance does not guarantee future results.