OVERVIEW
U.S. stocks were mixed last week. While the S&P 500 Index retreated 0.66% and the Dow Jones Industrial Average slipped 2.7%, the Nasdaq Composite rose 0.55%.
Growth stocks led the way, gaining about 0.3%, whereas value-oriented stocks fell around 1.45%.
As for foreign stocks, developed country stocks remained roughly flat for the week, whereas emerging markets gained around 0.62%.
The 10-year Treasury rate remained roughly where it started the week, dropping slightly to 3.48%. While short- and intermediate-term Treasuries saw slight gains, long-term Treasuries dipped about 0.5%. Investment-grade corporate bonds increased slightly by about 0.09%, and high-yield (junk) bonds dropped about 0.31%.
Commodities had a good week, rising about 0.5% broadly. Specifically, oil surged 2.14%, gold increased 0.33%, and corn rose 0.19%. The U.S. dollar weakened about 0.11%, and real estate fell about 0.56% to wrap up the week.
KEY CONSIDERATIONS
More Testing Needed – Well, it looks like those nasty resistance levels that we recently talked about gave the stock market some trouble last week.
As the red candlestick bar shows on the chart below, the S&P 500 faced a big wave of selling when it breached its 200-day moving average last week.
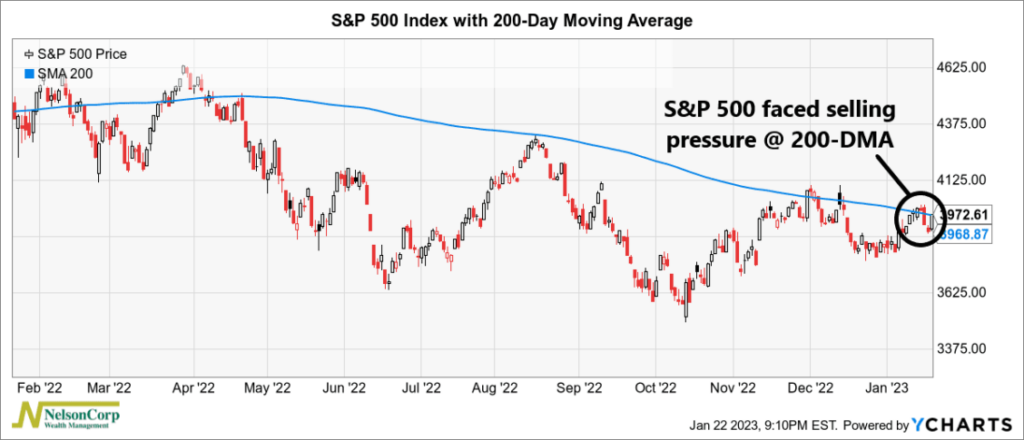
Basically, this is just a technical way of saying that a lot of people were looking to sell their stocks when the market reached these levels.
If that was a test, the market failed.
But it did have a nice rally to end the week, so it could still technically prove itself in the coming weeks.
I will say that we are seeing some technical themes develop under the hood that could suggest that this rally might have some legs to it.
Specifically, some of our price-based indicators are starting to show some real strength.
For example, in our Indicator Insights post last week, we highlighted a deviation-from-trend indicator that suggested that the stock market might be forming a new bullish trend.
As you can see from the indicator, shown below, the 3-month average price of the S&P 500 recently improved enough relative to its 1-year average price to trigger a “buy” signal.
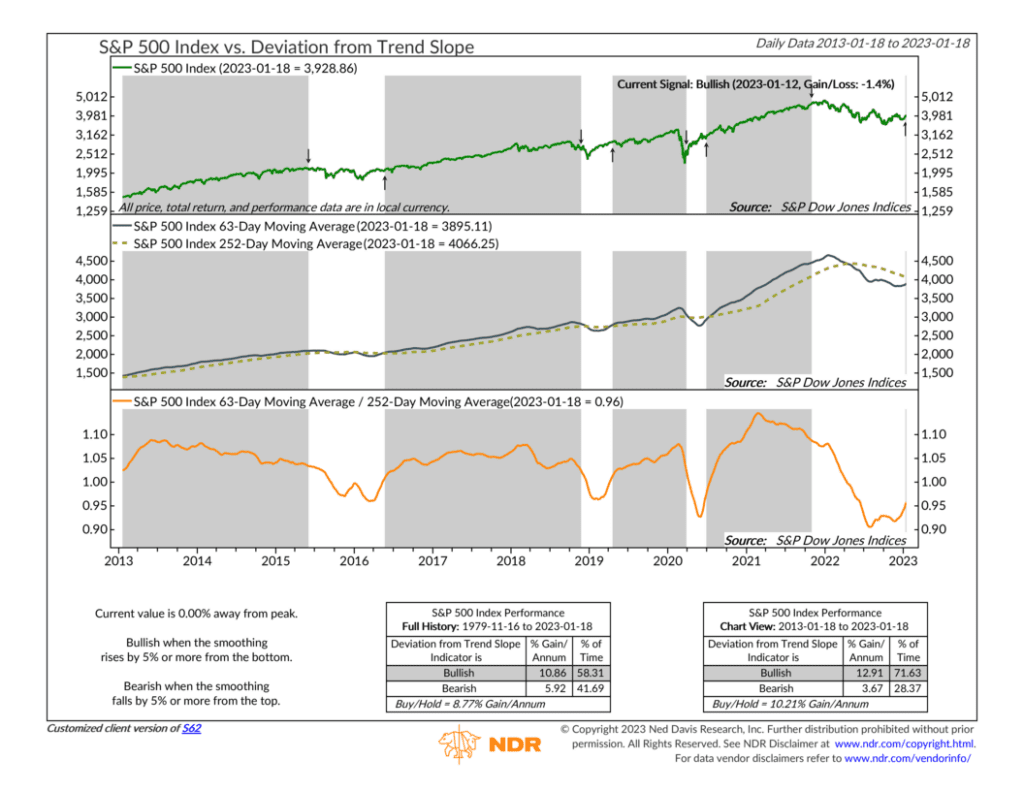
Some other indicators have also triggered “buy” signals.
This next one shows that the percentage of NYSE stocks reaching new lows fell to just 0.8% last week, its lowest level since the beginning of 2021.
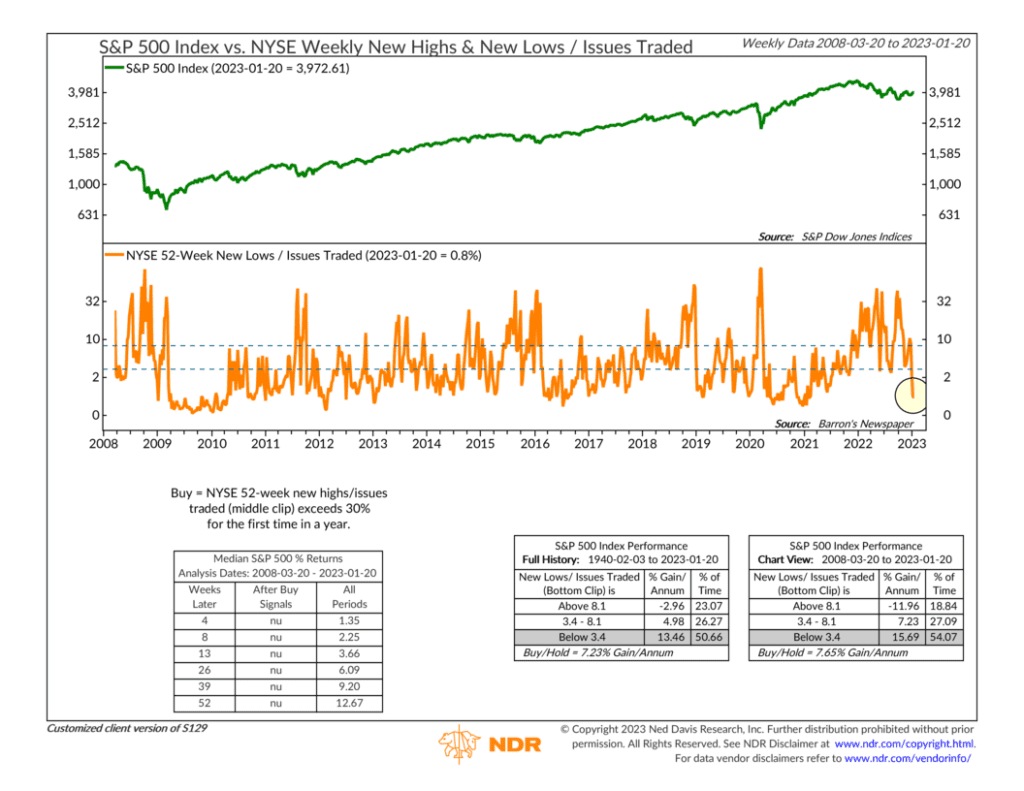
Historically, readings this low have corresponded with S&P 500 returns that are double its long-term buy-and-hold average return.
But, with that said, we like to look at the weight of evidence, and right now, that still needs to be clarified.
One thing we’re looking out for is a sentiment-type theme based on the CBOE VIX Index—a gauge of projected price swings in the S&P 500 that normally moves in the opposite direction of the index.
Last year, we saw firsthand how falling VIX readings were bullish (positive) for stocks, whereas low but rising VIX readings were bearish (negative) for stocks.
We quantify this phenomenon with the indicator below, which shows the 12-day average of the VIX divided by its 68-day average.
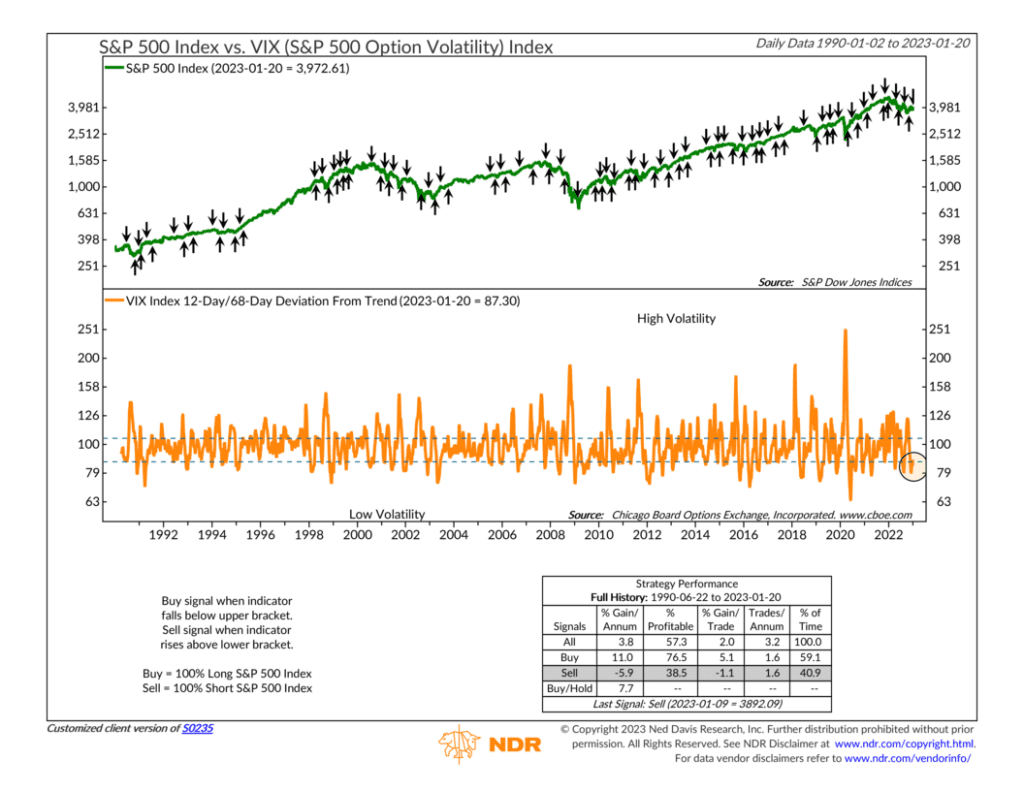
When it rises from a low level—like it recently did—it triggers a “sell” signal for the S&P 500 index. This isn’t a great sign from a market rally standpoint.
So, the bottom line? While we are seeing some technical strength emerge under the hood of the market, it’s still likely too soon to say that we’ve seen the last of the selling pressure.
This is intended for informational purposes only and should not be used as the primary basis for an investment decision. Consult an advisor for your personal situation.
Indices mentioned are unmanaged, do not incur fees, and cannot be invested into directly.
Past performance does not guarantee future results.