OVERVIEW
The U.S. stock market ended in mixed territory last week, with the S&P 500 falling 0.77%, the Dow Jones Industrial Average dropping 0.73%, and the Nasdaq Composite climbing 0.22%.
Economically sensitive small-cap stocks had another good week, rising more than 2.5%, whereas the 100 largest U.S. companies by market cap actually fell about 1% for the week.
International stocks outperformed their U.S. counterparts, with both developed and emerging market stocks gaining over 1%.
Bonds had solid gains across the board, as the U.S. 10-year Treasury yield dropped to 0.831% from 0.895% the prior week.
Commodities had a decent week, with oil gaining over 4% and corn rising more than 2%. Gold, however, dropped nearly 0.8%.
The U.S. dollar continued its bout of weakness, dropping around 0.4% for the week.
KEY CONSIDERATIONS
Motion Without Movement – The stock market’s moves over the past few months reminds me of a car stuck in the mud. You press the gas pedal and rev the engine, the wheels spin, but the car goes nowhere. There is motion, but no real movement.
On September 2nd, the S&P 500 stock index closed at a level of 3,580. Last Friday, it closed at 3,558. Looking at the chart of daily returns, we see a lot of motion during that time — a few big swings up and down, and even a new all-time high — but the index is back to where it started nearly three months ago.
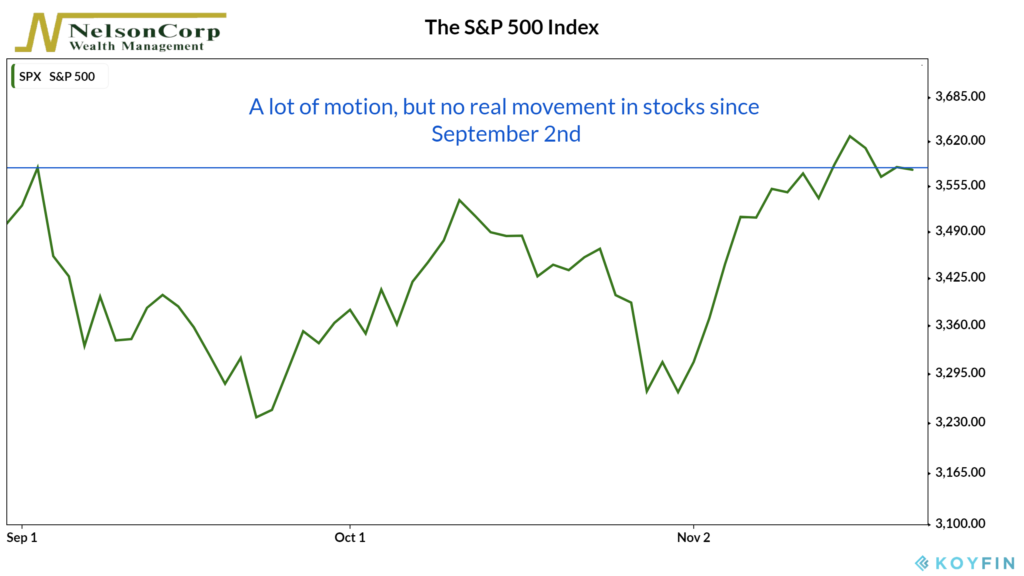
It feels like the market could go anywhere from here. But with the big rally from the March lows already baked into prices, it’s also hard to see how stocks could rally much more from here.
However, we do see some bright spots in this environment that are worth mentioning.
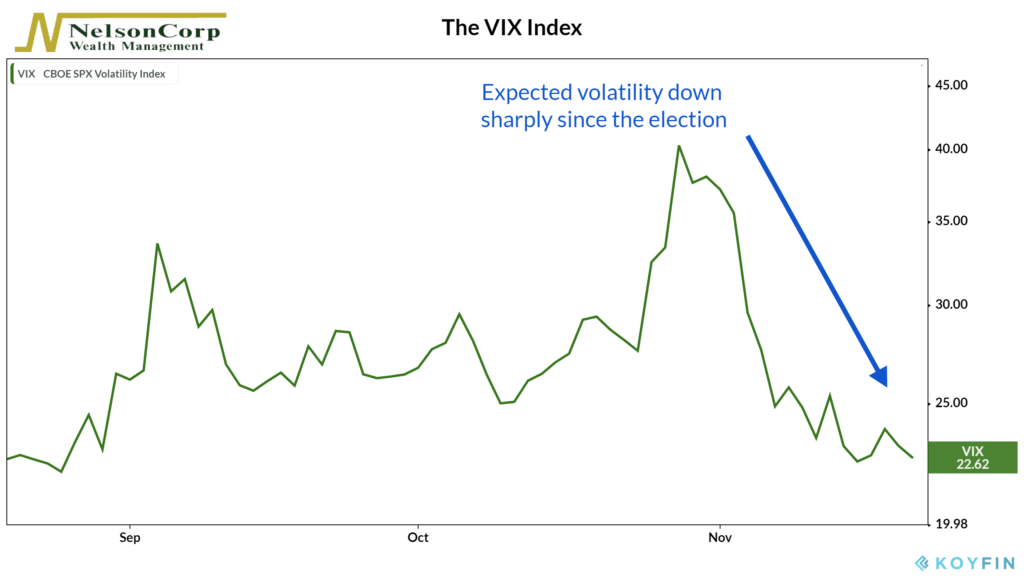
For starters, there was a lot of uncertainty surrounding the U.S. election. But with that past us, the market has rallied nicely. And the VIX index, a measure of anticipated stock market volatility, has fallen to a reading of around 22, which is down sharply from its recent high of 40 just before the election. This simply means that investors expect stock returns to be less volatile over the next month than before.
We’ve also seen the stock market broaden recently. By this, we mean that the percentage of S&P 500 stocks that are closing higher than their average 200-day price has risen to over 90%, the highest reading since 2014. Generally, more stock participation is a sign of a healthy market.
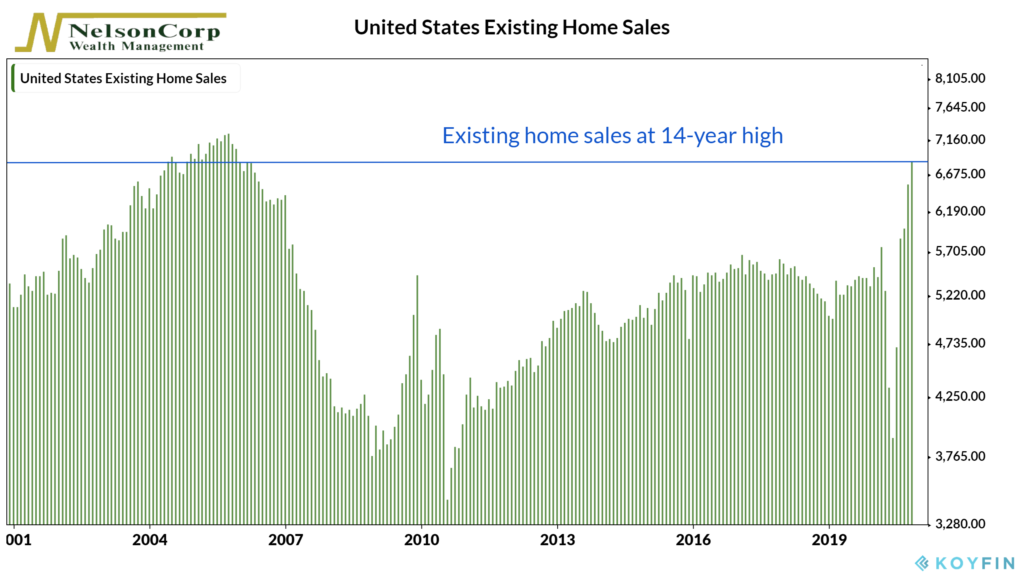
And finally, despite a struggling economy, the rare bright spot that has remained consistent over the past five months is U.S. home sales. According to the National Association of Realtors, existing-home sales rose 4.3% in October to a seasonally adjusted rate of 6.85 million, the highest level in 14 years. Remarkably, those increased sales in October were 26.6% higher than a year ago, before the pandemic hit.
So there seems to be enough kindling lying around to ignite a year-end rally for stocks potentially.
Nonetheless, we are also entering what looks to be the darkest hour yet in the pandemic, with daily new cases of the virus far surpassing earlier peaks — and deaths climbing fast behind.
And then there’s sentiment. The recent surge in stocks has pushed some of the indicators that we track, such as the Hulbert Newsletter Stock Sentiment Index, into a zone of extreme optimism, which we consider to be bearish.
We tend to be wary of the crowd at extremes because, as the French author Gustave Le Bon wrote in his book about crowd psychology, “in crowds it is stupidity and not mother wit that is accumulated.”
This is intended for informational purposes only and should not be used as the primary basis for an investment decision. Consult an advisor for your personal situation.
Indices mentioned are unmanaged, do not incur fees, and cannot be invested into directly.
Past performance does not guarantee future results.