OVERVIEW
The U.S. stock market suffered its worst week since October, ending a wild week on Wall Street.
The S&P 500 Index fell 3.31%, the Dow Jones Industrial Average dropped 3.27%, and the Nasdaq Composite declined 3.49%.
The declines in the U.S. were fairly consistent across the board, but mid-cap and value stocks were hit the hardest, declining nearly 5% and 3.5%, respectively.
Foreign stocks suffered large declines, as well. Developed country stocks fell about 3.45%, and emerging market stocks tumbled 4.54%.
Treasury bonds helped hedge the decline in equity prices, with longer-dated Treasuries mostly flat for the week. The U.S. 10-year Treasury Note fell to 1.064%.
Despite moderate declines in oil and gold prices, commodities overall managed to post gains due to a surge in corn prices, up more than 9% for the week.
The U.S. dollar strengthened a bit, gaining about 0.33% for the week.
KEY CONSIDERATIONS
Not Great, Not Terrible – In 2019, HBO released a miniseries about the 1986 Chernobyl nuclear power plant disaster in the Ukrainian SSR. In one of the scenes, the head of the power plant responds to the radiation measurement of 3.6 Roentgen as “not great, not terrible.” Of course, it actually ended up being pretty terrible because the dosimeter (the radiation measurement device) maxed out at 3.6, and the actual reading was much higher.
Looking at the price action in the stock market last week, however, there are reasons to believe that although the downturn was not great, it doesn’t look too terrible, at least based on where the weight of evidence stands today.
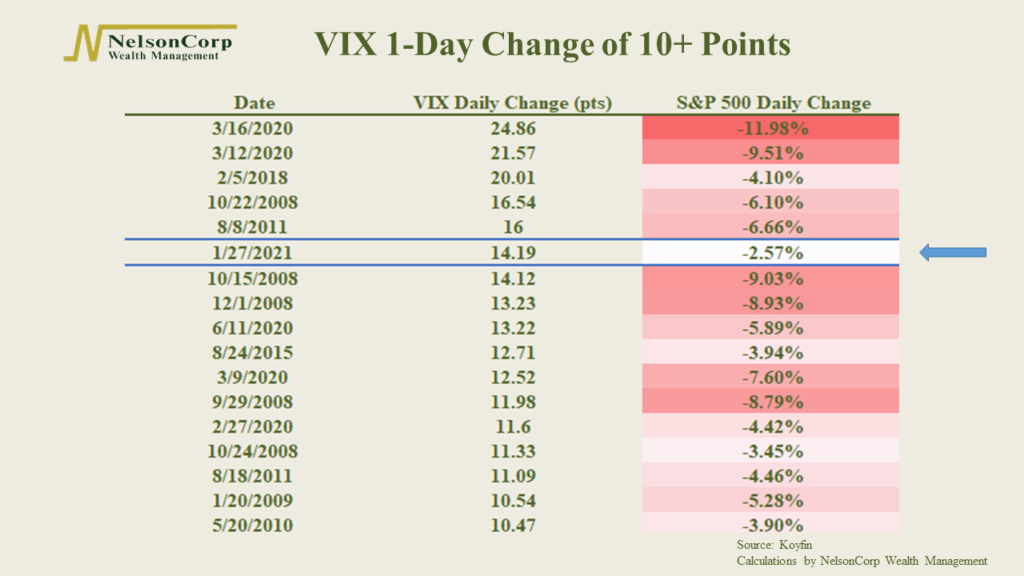
I’ll start with one interesting bit of information. We did see a dramatic surge in implied volatility last week. The VIX Index jumped 14.19 points on Wednesday, its 6th biggest 1-day point move since 1990. However, the S&P 500 only fell 2.57% that day, its smallest decline on record when the VIX has risen 10 points or more in one day.
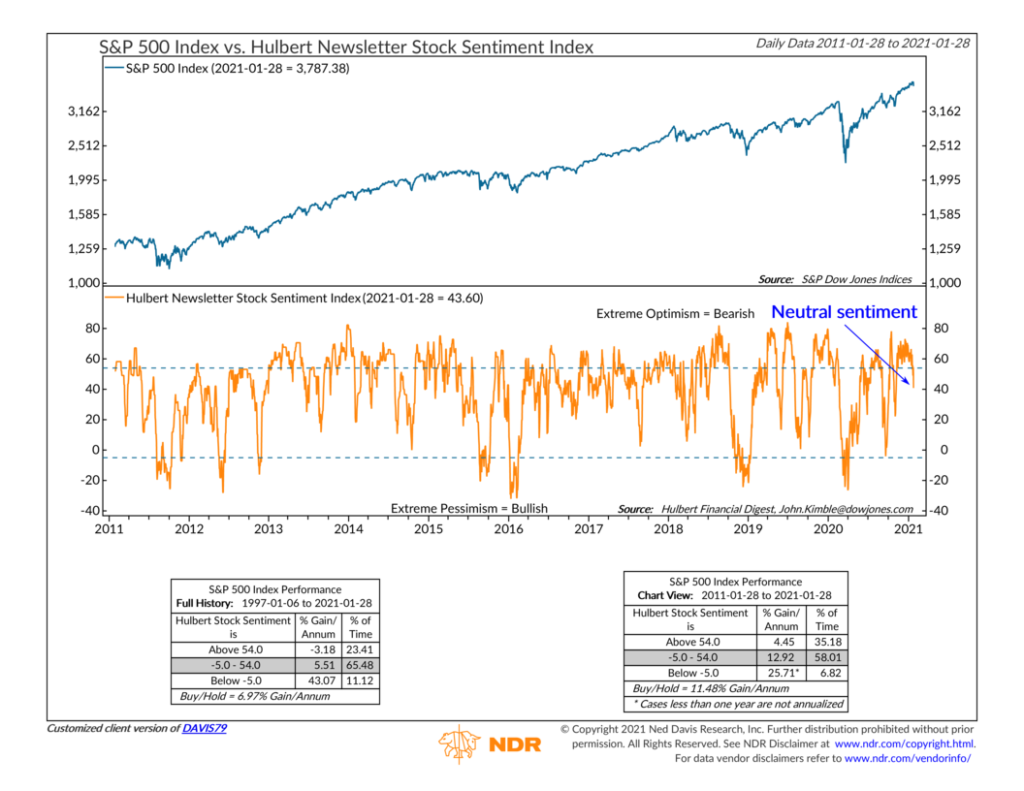
As for sentiment, a small but meaningful price correction could throw some cold water on the extreme levels of optimism we’ve seen in the market lately. Indeed, this is happening already. The Hulbert Newsletter Stock Sentiment Index dropped from an excessively optimistic reading of above 54 to around 40 last week. This is historically a neutral level that has corresponded with average market returns.
If we see more of the overly optimistic sentiment get washed away in the coming days, it will take some of the pressure off of the price movement component of our risk models. This would be welcome, as we did see some deterioration in global stock prices last week.
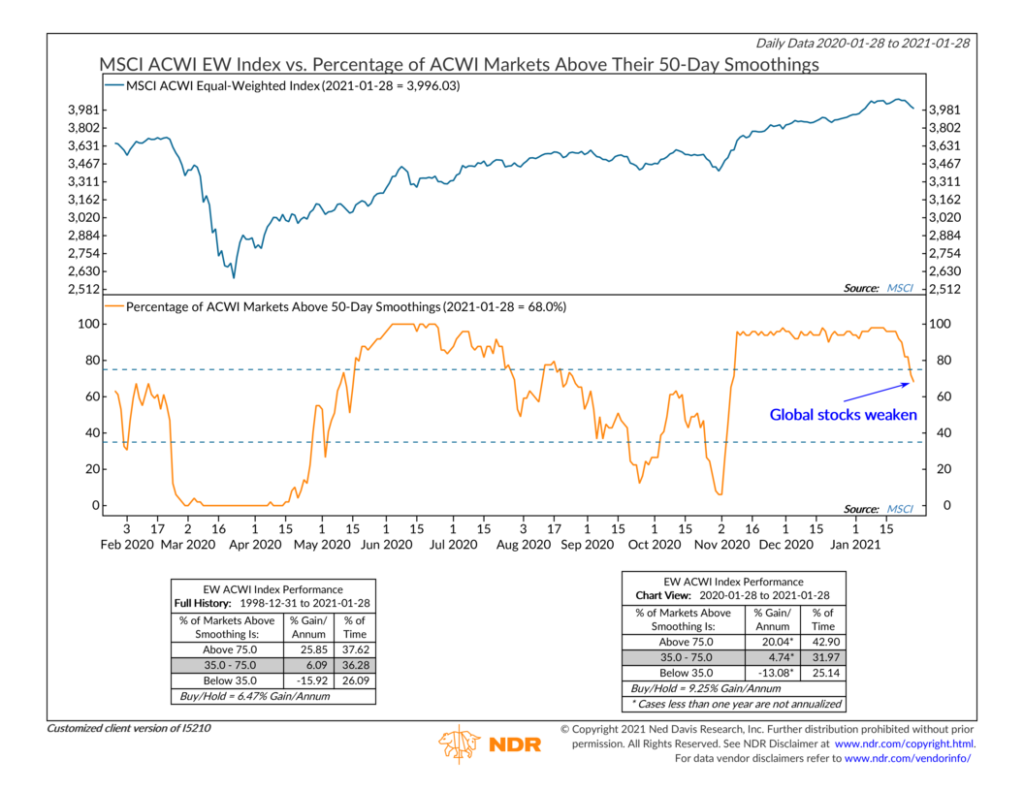
As the chart below shows, after hovering well above 90% for nearly three months, the percentage of global stock markets above their average 50-day prices fell below 70% last week. This neutral zone still equates to average market returns, but if it falls further (below 35%), it could spell trouble for stocks going forward.
In the end, it appears that the main areas of risk that we monitor are converging to a lower positive or potentially even a neutral zone, depending on how the price trend holds up; in other words: not great, but not terrible.
This is intended for informational purposes only and should not be used as the primary basis for an investment decision. Consult an advisor for your personal situation.
Indices mentioned are unmanaged, do not incur fees, and cannot be invested into directly.
Past performance does not guarantee future results.