OVERVIEW
The major U.S. stock indices fell for the second week in a row last week. The S&P 500 dropped 2.45%, the Dow fell 1.78%, and Nasdaq got slapped with a 4.92% decline.
Foreign stocks suffered declines as well. Developed country stocks dropped 2.85%, and emerging markets were hit with a 6.35% decline.
Interest rates on U.S. government bonds rose rapidly last week, causing a sell-off in fixed income assets. The yield on the 10-year Treasury note closed around 1.42% after briefly rising to nearly 1.53% at one point last week. Long-term Treasuries fell about 1.45%, investment-grade corporate bonds dropped 0.46%, and high-yield corporates fell nearly 0.6%.
Real assets did better but were still not great. Real estate dropped about 1.18%. Commodities were roughly flat, with oil gaining about 4% and corn rising around 1%, but gold falling 2.73%.
The U.S. dollar strengthened, gaining about 0.7% for the week.
KEY CONSIDERATIONS
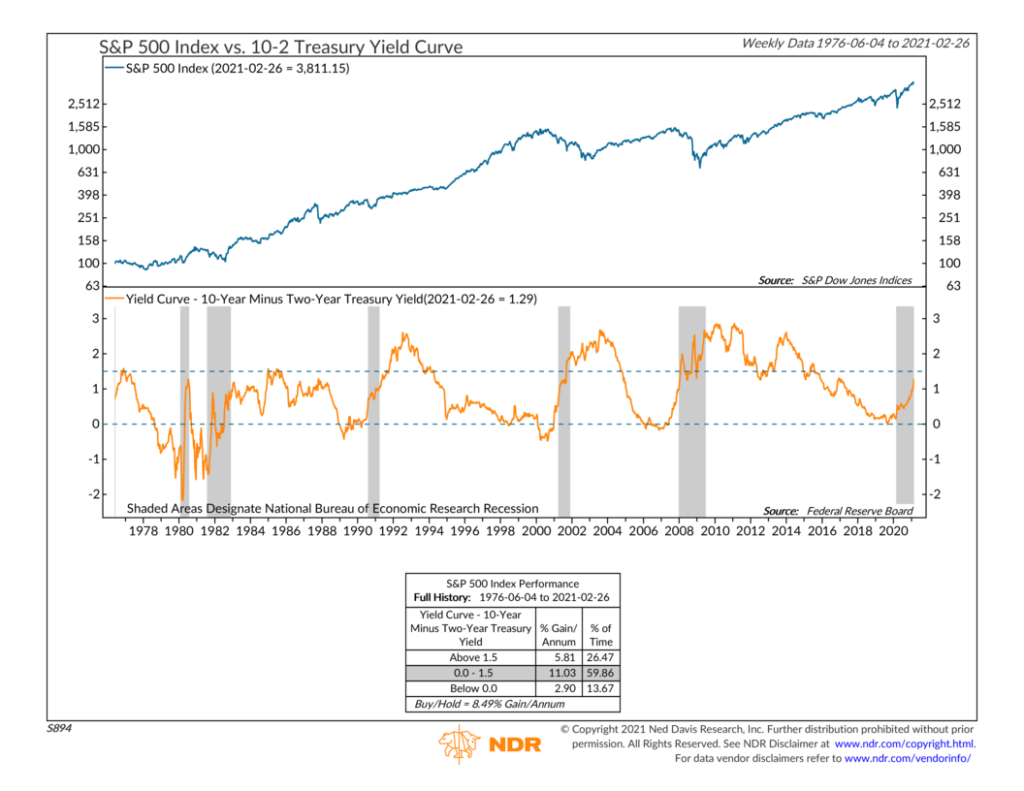
Punitive Rates – The bond market was thrown into a tizzy last week. We’ve seen an increase in interest rates across the yield curve, with the most severe increases occurring near the longer end of the curve. The spread between the 10-year Treasury note yield and the 2-year Treasury note yield has expanded to around 1.3%, its highest level since early 2017.
While bad for bonds with longer durations, this could potentially affect stocks, as the chart below shows. A moderately upward sloping yield curve is generally positive for stocks. Yet, if the spread between the 10-year and 2-year Treasury note yields climbs above 1.5%, it has historically produced more moderate gains in the stock market. We aren’t there yet, but we are getting closer.
We’ve also seen a pickup in the rate at which medium-quality corporate bond yields are rising, which can hurt stock returns.
For example, this next chart shows the 26-week change in the Moody’s Baa Corporate bond yield index. The bonds in this series are considered the lowest level of investment-grade and represent a typical large corporation’s long-term borrowing costs. Thus, changes in the yields on these bonds often set the tone for the stock market.
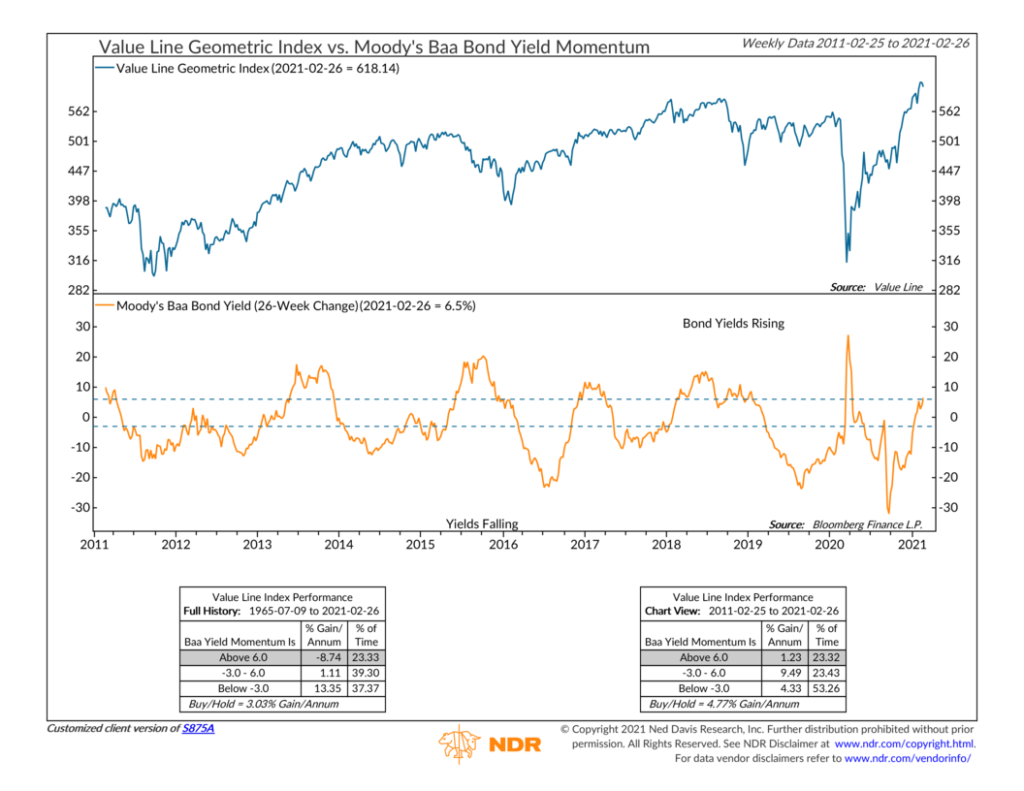
Relative to about six months ago, these corporate bond yields have increased at a rate of about 6.5%. This is currently a negative level for stocks. Historically, this has resulted in negative average annual returns for the S&P 500.
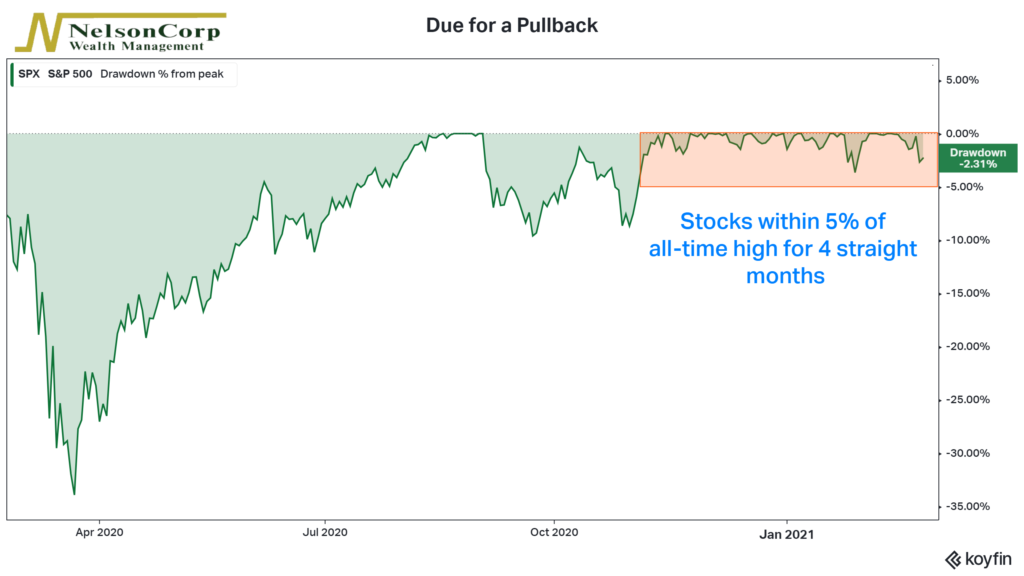
Regardless of rates, however, the stock market is probably overdue for a pullback. The S&P 500 has been within 5% of its all-time high for four straight months.
Plus, we are currently experiencing the best start to a new cyclical bull market since the 1930s. Historically, these initial recoveries from recessionary lows usually last around ten months, followed by a few months of sideways stock trading and maybe a dip or correction. So, by historical standards, what we are seeing is not all that unusual.
This is intended for informational purposes only and should not be used as the primary basis for an investment decision. Consult an advisor for your personal situation.
Indices mentioned are unmanaged, do not incur fees, and cannot be invested into directly.
Past performance does not guarantee future results.